Announcement

Collapse
No announcement yet.

no responding for 40 seconds

Collapse
X
 
  • Filter
  • Time
  • Show
Clear All
new posts

  • no responding for 40 seconds

    I upgraded my esignal to the alpha release and the first efs I tried caused the esignal no responding for quite a long time. Here is the script.

    Also it seems there is nothing new besides the EFS2 support in the alpha release. Right?

    -- Clearpicks


    /**********************************/
    var vSymbol;
    var vInterval;
    var vol;
    var c, o;
    var t, t2;

    var vVolume, vVolume1;

    var fgColor;

    var scale;

    var m, m1;
    var symbol1;

    function preMain() {
    setPlotType( PLOTTYPE_HISTOGRAM, 0 );
    setPlotType( PLOTTYPE_LINE, 1 );
    setStudyTitle("ColoredVolumeOnly");
    setDefaultBarThickness( 2 );
    setDefaultBarFgColor(Color.blue);
    setShowCursorLabel(false);
    }

    function main() {

    if ( getBarState() == BARSTATE_ALLBARS ) {
    vSymbol = getSymbol()+","+getInterval();
    symbol1 = getSymbol()+",1";
    m1 = null;
    vInterval = getInterval();
    }

    vol = volume(0, -3);
    c = close(0, -2);
    o = open(0, -2);

    vVolume = vol[0];
    vVolume1 = vol[1];

    if ( c[0] >= o[0] ) {
    fgColor = Color.green;
    setBarFgColor(Color.green);
    }
    else {
    fgColor = Color.red;
    setBarFgColor(Color.red);
    }


    if ( getInterval() == "D" && getCurrentBarIndex() == 0 ) {
    m = getValue("minute", 0, -1, symbol1); m = m[0];
    }

    return vVolume;
    }
  • #2
    Hi clearpicks,

    Try it in a chart that is not Daily, the problem is from your getValue call in line 53. Looking at the getValue call, it does not match up with the format in Chris's help file for efs2 and getValue.
    (edit) - checked with Chris, he modified getValue in help file to reflect this should work.
    Last edited by Guest; 02-26-2005, 09:58 AM.

    Comment


    • #3
      Steve,

      Thanks for the reply. It seems efs2 is not fully compatible with the older efs (at least it didn't pass my simple test).

      How can I retrieve the close values of a few bars as I do using function calls like getValue("close", 0, -10, "QQQQ,1") in the older EFS? How much overhead is introduced by using sym() and inv()? Is it still true that any new tick data of the symbols used in an efs may trigger a calling of main() thus more overhead? Because I use none of those classic indicators in my trading system, I am not very impressed by the coding simplicity due to the new api's such as sym() and inv(). Actually I have done much more complex multi timeframe coding and charting using the existing EFS APIs. What is the most important to me is the efficiency and robustness of the APIs.

      -- Clearpicks

      Comment


      • #4
        Hi Clearpicks,

        All of the existing EFS1 functions are still available, so you can use your old getValue("close",.....) functions.

        sym(), inv() calls incur the overhead of one additional symbol per EFS. Somewhat like the old EFS1 getValue("...") functions on a different symbol/interval.

        OLD: New ticks do come in and execute the main() function, just like in EFS1.

        EDIT: Actually I re-read that and that's incorrect. Using sym() or inv() alone inside your EFS is just like using getValue("..."<symbol>), your main() won't be called on each tick of that sym() or inv(). Likewise, using it in a builtin function to gain access to let's say an ema of INTC,5. YOUR main() won't be called on each INTC tick (unless it's already INTC). But the ema() calculation will happen on each INTC tick (as expected). Now, if you use sym()/inv() in an efsInternal() or efs() call, building your own custom Series on a different interval, then yes, the main() of that new EFS will be called on each tick, as expected.

        It is true that EFS2 is mainly for folks who need a simple way of getting synchronized access to data across on multiple time frames, and the ability to use built in studies or their own studies as sources to other built in or custom studies (on this or other timeframes/symbols). Basically if you had to do multi time frame data grabbing using two different EFS files with global variable passing, EFS2 will be much more efficient. if you are just using the getValue("..." <symbol>) calls, please continue to do so, as those are still in tact and have not changed. While the multi time frame stuff is a major component of EFS2, I feel that the other enhancements such as efs() and efsInternal() calls, plus the new FunctionLibrary have equal weighting in importance (although these last three may benefit the 3rd party developers more than one-off EFSs for users).

        The alpha contains a number of other bug fixes, Point & Figure charting differences, amoung other things.

        I'll have a look into why your script is taking so long to execute on the alpha. Definitely if there are ANY imcompatibilities noted (in efficiency or syntax, etc..) Please send them my way ASAP so that we can get them addressed. This is the goal of the Alpha release, in order to get as many issues/compatibilities resolved before the final release.

        Thanks!

        Comment


        • #5
          I'd also like to add that the purpose of allowing this Alpha release to be available to external users is to help us test the new functionality of EFS2 and not discuss the relative value of EFS1 vs. EFS2 or go into the different reasons a user would do things one way or another. Once we get the bugs sorted out and have a stable core code for EFS2, we'll be in a better position to take a look at the directions we want/need to go to make this a valuable tool.

          Thank you,

          Comment


          • #6
            DionLoy,

            I installed alpha release by overwriting the 7.8 installation. I am not sure how my testing script will behave in a fresh new installation. Hope this is of some help when you try to find out what caused the problem.


            -- Clearpicks

            Comment


            • #7
              Dion
              What is happening in the case of Clearpicks' script (even when converted to EFS 2 syntax) is that when on a higher interval and calling a lower interval the engine requests and downloads as much data as possible to match the higher interval. In the specific case if one has for example 300 bars of Daily data loaded that could imply a download of 60+ days of 1 minute bars (judging by the time it is taking to execute the code). To verify this behavior one can set up a Time Template with only 10 Days of Daily data and then run the script. The load time for the efs at that point is virtually none.
              One way to overcome this issue would be to have the engine always reference the Time Template used in that chart and download only the amount of data set for each interval (or if none is defined use the Intraday Default).
              Alex

              Comment


              • #8
                Thanks Alex, that's a good idea. For Build 698 I think I will add a preMain function:

                setBackfillMultipleTimeframes(true/false)

                I believe since Build 696 this has been set to 'true'. Which will result in the lengthy downloads as clearpicks has seen (his attempts to grab the minute data for as many days as his script has loaded on the daily chart). This is required though for some studies like the Woodie's CCI guys, who look at the 344T on other T or minute charts.

                I will default this to 'false' for Build 698, and apply the standard time templates to the other intervals. This way folks can set if they want to backfill the multiple timeframes or not.

                Comment


                • #9
                  Okay folks, for Build 698, 'setIntervalsBackfill()' has been added. It defaults to FALSE (same behavior as 7.8). If you need to backfill your interval data up to the main chart's interval, then set it to TRUE (ie, needing enough 1 min bars to fill a 10 min chart for instance). Of course in clearpicks' EFS below, if you set it to true, it will attempt to load enough 1 minute bars to fill his daily chart, which of course takes forever =).

                  I've tested against the EFS below, and it loads instantaneously if you do not backfill the intervals.

                  Comment


                  • #10
                    What about the flip side? I'm running a volume/tick chart that is using a time template of 3 days. I wanr to plot an indicator using daily bars on the chart. If I understand correctly, Data Manager would only down load 3 days of daily bars. However, my indicator requires 300 bars to normalize. So I need 300 bars of daily data.

                    I think one way around this problem would be to remove the restriction of being only able to set # Days to 10 or less when using the Bars radio button on the time template form.

                    Comment


                    • #11
                      scjohn
                      Just set up the Time Template used in the chart to load the required #Days/Bars for the Daily interval.
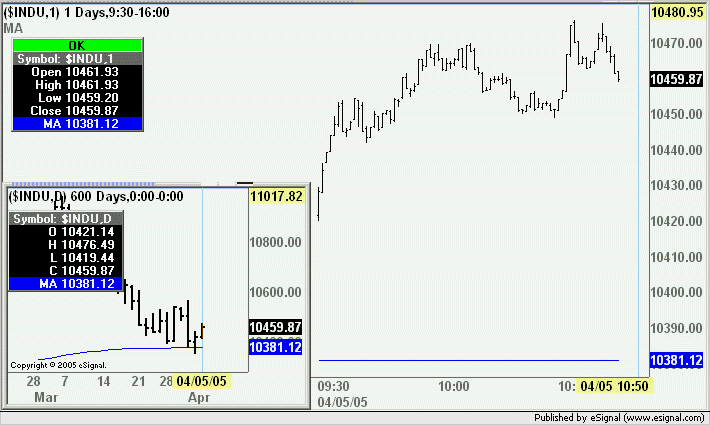
                      In the image below you can see that the 1 min chart is set to load only 1 day of data and in it I am plotting a 200 period MA based on the Daily. This was done using the customMA.efs that is in the EFS2 Custom folder of Formulas
                      Alex

                      Comment


                      • #12
                        Alexis,

                        I freely admit that I have never fully understood Time Templates. I have the ESignal help comments less than satisfacotry in explaining exactly how they work. I can set one up but my confusion starts when you have multiple sub entries in a template. I never understood or could find an explaination for this feature.

                        If I read your response correctly, I would have 1 time template with 2 entries in it. One entry would be for my volume chart. I could set the # of Days to 3 with an interval of V and the Days radio box checked. I would then add a new entry for days. For this entry I would use an interval of D and set the # of Days to 200 as per your example. I would also have the Days radio box checked. Now, when I request daily data, Esignal will use the sub entry with a time interval of D to control to determine the amount of data to download.

                        Note: I would still like to see the 10 restriction removed when set up an interval of T or V.

                        Thanks

                        Comment


                        • #13
                          scjohn
                          A Time Template is nothing else but a set of instructions for your chart.
                          It can contain only one setting to apply to all intraday intervals or any number of settings for specific intervals. This arrangement allows IMO for the maximum flexibility when setting up charts or when using multiple time frame efs(s).
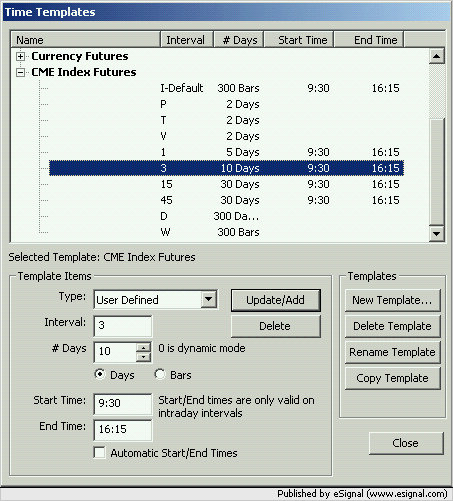
                          In the following example you can see one of the Time Templates I use for Equity Index futures.
                          For all the intraday intervals that are not specified the Time Template will load 300 Bars (the Intraday Default) setting the Start/End time to 9:30-16:15. For the listed intraday intervals the Time Template will instead use the corresponding settings.
                          If I load a Daily chart (or call a Daily interval in an efs) it will load 300 days. In your case that would be sufficient to prime your indicator.
                          If you do not specify #Days/#Bars setting for Daily (or higher) intervals the Time Template will default to Dynamic Mode ie it will load as much data as is required to fill a chart otherwise it will use the appropriate setting. Note also that #Days and #Bars when used with Daily intervals produce different results.
                          Hope this helps
                          Alex

                          Comment

                          Working...
                          X