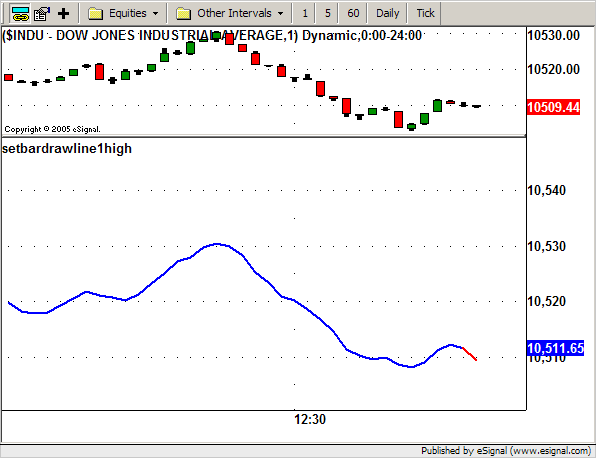
The attached file contains the script for creating an array and then using the array to draw a line. The chart shows the [0] data point plots correctly but the prior ones do not. What have I done wrong?
Your help is greatly appreciated.
Best Regards,
Alan
Your help is greatly appreciated.
Best Regards,
Alan

Comment