Announcement

Collapse
No announcement yet.

Using An Array To Draw A Line

Collapse
X
 
  • Filter
  • Time
  • Show
Clear All
new posts

  • Using An Array To Draw A Line

    The attached file contains the script for creating an array and then using the array to draw a line. The chart shows the [0] data point plots correctly but the prior ones do not. What have I done wrong?

    Your help is greatly appreciated.

    Best Regards,

    Alan
    Attached Files

  • #2
    Hello Allan,

    In your drawLine calls you are referencing negative array elements, which do not exist. When referencing your array you just need to use positive references. Try the following.

    PHP Code:
    /*******************
    Draw a line for a custom EFS
    *******************/

    var vColor Color.white;
    var 
    aMyArray null;
    var 
    vReturn null;

    function 
    preMain() {

        
    setPriceStudy(true);
        
    setStudyTitle("drawllinesarray");
        
    setCursorLabelName("MA1"0);
        
    setDefaultBarStyle(PS_SOLID0);
        
    setDefaultBarFgColor(Color.blue0);
        
    setDefaultBarThickness(20);
        
    setPlotType(PLOTTYPE_LINE0);
        
    setDefaultChartBG(vColor);    
          
    }

    function 
    main(nRef) {

     var 
    nState getBarState();

        if (
    nRef != nullnRef Math.abs(Math.round(nRef));
        if (
    nRef == nullnRef 5;    
        
        if (
    aMyArray == nullaMyArray = new Array(nRef+1);
        
        if (
    nState == BARSTATE_NEWBAR && vReturn != null) {
            
    aMyArray.pop(); 
            
    aMyArray.unshift(vReturn);
        }


    vReturn high(0)+1;
     
        
    aMyArray[0] = vReturn;


    drawLineAbsolute(0aMyArray[0], -1aMyArray[1], PS_SOLID2Color.black"Basis1");
        
    drawLineAbsolute(-1aMyArray[1], -2aMyArray[2], PS_SOLID2Color.black"Basis2");
        
    drawLineAbsolute(-2aMyArray[2], -3aMyArray[3], PS_SOLID2Color.black"Basis3");
        
    drawLineAbsolute(-3aMyArray[3], -4aMyArray[4], PS_SOLID2Color.black"Basis4");
        
    drawLineAbsolute(-4aMyArray[4], -5aMyArray[5], PS_SOLID2Color.black"Basis5");
        
    //drawLineAbsolute(-5, aMyArray[5], -6, aMyArray[6], PS_SOLID, 2, Color.black, "Basis6");

        
    return vReturn;

    Jason K.
    Project Manager
    eSignal - an Interactive Data company

    EFS KnowledgeBase
    JavaScript for EFS Video Series
    EFS Beginner Tutorial Series
    EFS Glossary
    Custom EFS Development Policy

    New User Orientation

    Comment


    • #3
      Draw Lines

      Jason,

      Thank you for the correction.

      The corrected code is attached and works fine. When I set the PriceStudy to false I get a straight line in the lower portion of the chart. My eventual goal is to replace the high variable with an oscillator which moves +- 0 and is brought into the study by a getGlobValue function. Can drawLineabsolute be used to accomplish this goal? If not could you suggest an alternate methode to draw the oscillator?

      You assistance is greatly appreciated.

      Best Regards,

      Alan
      Attached Files

      Comment


      • #4
        Hello Alan,

        Just so you know, you can attach .efs files here in the forums. You don't have to copy your code to a word doc.

        For your formula, why not just return vReturn to your chart instead of using drawing functions to create the line?

        Try adding return vReturn; to the end of main().

        The reason you're getting the flat line is because you're not returning a data series to the chart, so it has nothing to base it's scale on. The drawing functions will not affect the y-axis auto-scaling. If you insist on using the drawing functions, then you'll need to use setStudyMax(nValue) and setStudyMin(nValue) to control the y-axis scale.
        Jason K.
        Project Manager
        eSignal - an Interactive Data company

        EFS KnowledgeBase
        JavaScript for EFS Video Series
        EFS Beginner Tutorial Series
        EFS Glossary
        Custom EFS Development Policy

        New User Orientation

        Comment


        • #5
          Draw Lines

          Jason,

          Thank you for the comments. This sample efs is constructed to plot the current high on point 0 and a 3 period centered moving average of high on chart points 1...9. I think "return vReturn" will plot an end centered 3 period moving average. Is there any way other than drawline to do this when a single continuous line is constructed from two different variables?

          Is there a way to produce an auto scaling capability when using drawline versus the setScaleMax fixed function so the scale would adjust automatically like the "return vReturn" does?

          Best Regards,

          Alan

          Comment


          • #6
            Hello Alan,

            Thank you for the comments. This sample efs is constructed to plot the current high on point 0 and a 3 period centered moving average of high on chart points 1...9. I think "return vReturn" will plot an end centered 3 period moving average. Is there any way other than drawline to do this when a single continuous line is constructed from two different variables?
            Sounds like we're getting back to a topic we previously discussed in this thread, Array for CMA. Are you working on the same issues here? Please describe the end goal that you are trying to accomplish.

            Is there a way to produce an auto scaling capability when using drawline versus the setScaleMax fixed function so the scale would adjust automatically like the "return vReturn" does?
            Not without returning a data series to the chart with the return statement at the end of main. The only other way to set the scale is with the setStudyMax()/setStudyMin() functions.
            Jason K.
            Project Manager
            eSignal - an Interactive Data company

            EFS KnowledgeBase
            JavaScript for EFS Video Series
            EFS Beginner Tutorial Series
            EFS Glossary
            Custom EFS Development Policy

            New User Orientation

            Comment


            • #7
              Draw Lines

              Jason,

              Thank you for the response.

              The current goal is to plot a single, continuous line composed of two pieces which is an oscillator moving +- 0. The prior thread addressed a single line set back from the right side of the chart. The current goal builds off this prior topic. The dilemma is I do not know how to make setbar or return do what drawline can accomplish in my sample code.

              The line to be plotted is composed of two separate sections.
              For discussion purposes and referencing my sample code, envision the back section of the line is a simple centered moving average. In my example this is a 3 period centered moving average of the high. If this was plotted, there wold be no line connecting the first and second points on the chart. In a second calculation, data is determined for the front of the line and plotted connecting the first and second points in a continuous line. In the sample, the high is plotted at point 0 and connects to the centered moving average at point 1 with the centered moving average continuing as far back as the drawline commands extend. Note the color was changed in the drawline to highlight the first section from the second section.

              It is a tedious process with drawline.

              If the two calculations were stored in two separate arrays, could a series of "do loops" populate calculation 1 into the first section of a third array and a second "do loop" populate the rest of the third array with the second calculation? Then could the third array be returned such that the scale would remain self adjusting like setbar or return?

              The connecting point would always be constant in the efs. As an example, the first "do loop" would populate the third array from element 0 through 5 and the second "do loop" would populate element 6 back to the beginning of the third array.

              Grab a fresh cup of coffee and think this one through. Your assistance is greatly appreciated.

              Best Regards,

              Alan

              Comment


              • #8
                Hello Alan,

                I wouldn't use drawLine in your case. I think the best thing to do is use setBar(). Here's what I would do, assuming we're plotting only 1 line and the value of the line at bar -2 (3rd bar from right) will be the centered moving average value. The values for bar -1 and 0 will come from your second calculation that determines the front two segments of the line.

                For the return statement at the end of main() return the current value of your second calculation. Somewhere in main before the return statement, add a routine that looks for BARSTATE_NEWBAR and calls setBar() to change the value and color of bar -2 to be the value and color of the cma.

                PHP Code:
                if (getBarState() == BARSTATE_NEWBAR) {
                    
                setBar(Bar.Value, -1YourCMAvalue);
                    
                setBar(Bar.FgColor, -1Color.color)

                Note the -1 bar index reference in the setBar calls. There is a bug in the 7.8 version where the index is being adjusted by -1 in error at NEWBAR. So you need to use an index of -1 here to change the values on bar -2. This is fixed in 7.9, so once you upgrade to 7.9 you will be able to reference bar -2 in the setBar calls as we originally intended.
                Jason K.
                Project Manager
                eSignal - an Interactive Data company

                EFS KnowledgeBase
                JavaScript for EFS Video Series
                EFS Beginner Tutorial Series
                EFS Glossary
                Custom EFS Development Policy

                New User Orientation

                Comment


                • #9
                  Draw Line

                  Jason,

                  Thank you for the suggestions.

                  I created an efs to use the setbar function and noticed subtle differences in the left / right registration and also differences in the shape of the line as compared to a separate chart using the drawline function.

                  The attached file has both lines included in a single efs. x4 is the plotted variable brought into the efs from a separate efs using global. The drawline function uses x4+1 to plot a line 1 unit above the setbar line. The first point for the drawline function should be x4+1. All subsequent points should be a 3 period centered moving average of x4+1 starting on the second point (black line ). The setbar function line should be the same except using just x4 ( blue line ).

                  Note sometimes the two lines appear to be ok and sometimes they appear offset. Also note the slope of the line segment between the first and second points for the setbar is different from the same segment on the drawline.

                  The setbar is much easier to use. I would appreciate your review of the script and comments on how I should correct it to get the two lines to match.

                  Best Regards,

                  Alan
                  Attached Files

                  Comment


                  • #10
                    Draw Line

                    Jason,

                    Attached is the chart that goes with my prior posting.

                    Best Regards,

                    Alan
                    Attached Files

                    Comment


                    • #11
                      Draw Line

                      Jason,

                      Attached is a script that is the same as previously submitted except the x4 variable imported by global was replaced with the high of symbol ym m5. The lines appear to be parallel. Could the problem be with the global command?

                      Best Regards,

                      Alan
                      Attached Files

                      Comment


                      • #12
                        Daw Line

                        Jason,

                        Attached is a copy of the chart showing the x4 script on top and the high script on the bottom.

                        Best Regards,

                        Alan
                        Attached Files

                        Comment


                        • #13
                          Hello Alan,

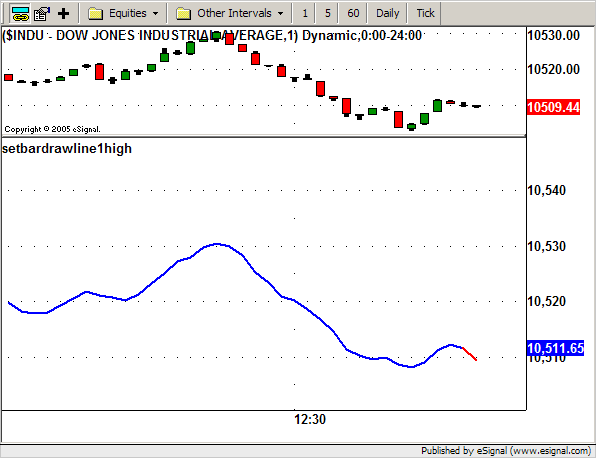
                          You were getting very close. There were a few logic errors. I won't go into detail. Following the advice I gave you in my previous post, this is what the code should look like below. I left in the one drawLine call just to show you it matches the last line segment. As I previously mentioned, you don't need drawLine for this routine. Compare the differences in this code example to your last formula to see what I'm doing differently. It should become pretty clear. I used close() in this example for the second data series. You'll replace close() with your second calculation.


                          PHP Code:
                          /*********************************************************
                          Draw a line for a custom EFS
                          **********************************************************/

                          var vColor Color.white;
                          var 
                          aMyArray null;
                          var 
                          vReturn null;
                          var 
                          aMyArray1 null;
                          var 
                          vReturn1 null;


                          function 
                          preMain() {

                              
                          setPriceStudy(false);
                              
                          setStudyTitle("setbardrawline1high");
                              
                          setCursorLabelName("MA1"0);
                              
                          setDefaultBarStyle(PS_SOLID0);
                              
                          setDefaultBarFgColor(Color.red0);
                              
                          setDefaultBarThickness(20);
                              
                          setPlotType(PLOTTYPE_LINE0);
                              
                          setDefaultChartBG(vColor);    
                              
                          //setStudyMax(10550);
                              //setStudyMin(10500); 
                          }

                          function 
                          main(nRefnRef1) {
                              var 
                          x4 getGlobalValue("Green1");
                              var 
                          pp1 0;
                              var 
                          nState getBarState();

                              if (
                          nRef != nullnRef Math.abs(Math.round(nRef));
                              if (
                          nRef == nullnRef 30;    
                              if (
                          aMyArray == nullaMyArray = new Array(nRef+1);

                              if (
                          nRef1 != nullnRef1 Math.abs(Math.round(nRef1));
                              if (
                          nRef1 == nullnRef1 30;    
                              if (
                          aMyArray1 == nullaMyArray1 = new Array(nRef1+1);
                              
                              if (
                          nState == BARSTATE_NEWBAR) {
                                  if (
                          vReturn != null) {
                                      
                          aMyArray.pop(); 
                                      
                          aMyArray.unshift(vReturn);
                                  }
                                  if (
                          vReturn1 != null) {
                                      
                          aMyArray1.pop(); 
                                      
                          aMyArray1.unshift(vReturn1);
                                  }
                              }
                            
                              
                          vReturn1 vReturn;
                              
                          aMyArray1[0] = vReturn1;

                              
                          vReturn = (((high(0)+high(-1)+high(-2))/3)+1);
                              
                          aMyArray[0] = vReturn;

                              
                          // replace close() with your other calculation.
                              
                          drawLineRelative(0close(), -1aMyArray1[0], 
                              
                          PS_SOLID2Color.red"Basis1");


                              if (
                          getBarState() == BARSTATE_NEWBAR) {
                                  
                          //setBar(Bar.Value, -1, (vReturn));   // use in 7.9 or later
                                  //setBar(Bar.FgColor, -1, Color.blue) // use in 7.9 or later
                                  
                          setBar(Bar.Value0, (vReturn));
                                  
                          setBar(Bar.FgColor0Color.blue)
                              }
                            
                              return 
                          close();

                          Jason K.
                          Project Manager
                          eSignal - an Interactive Data company

                          EFS KnowledgeBase
                          JavaScript for EFS Video Series
                          EFS Beginner Tutorial Series
                          EFS Glossary
                          Custom EFS Development Policy

                          New User Orientation

                          Comment


                          • #14
                            Draw Line

                            Jason,

                            Thank you for the suggestions. There appears to be something else going on here.

                            I started with the code you provided. I added more drawline to look at the shape of the setbar versus drawline. When I saw differences I removed the global and one on the arrays and shifted over to the close of the Dow $indu.

                            The setbar ( blue line ) is running on the close then overwritten by the three period centered moving average of the dow starting on the second point from the right ( vreturn ).
                            Te drawline starts with the close + 5 and shifts over to the 3 period cma + 5. This gives clarity to the two line shapes on the chart. The two lines should be parallel and have the same inflection points and timing. They do not.

                            Please NOTE, Doc 102 is am image of the efs after it has run on playback for 30 seconds to one minute and then paused. Doc 103 is the same image after I noticed doc 102 was different and I reloaded the efs. 102 lines are different when it was running and they did not shift after I paused. In Doc 103 the blue setbar line shifted back to the shape of the black drawline. This implies something strange is going on in the code causing the setbar to drift after a period of time and then move back to the drawline after a reload.

                            I have looked at this code for an hour and I can not find the forest for the trees. Your assistance is greatly appreciated.

                            Best Regards,

                            Alan
                            Attached Files

                            Comment


                            • #15
                              Jason,

                              Attached is the chart after pause.

                              Best regards,

                              Alan
                              Attached Files

                              Comment

                              Working...
                              X