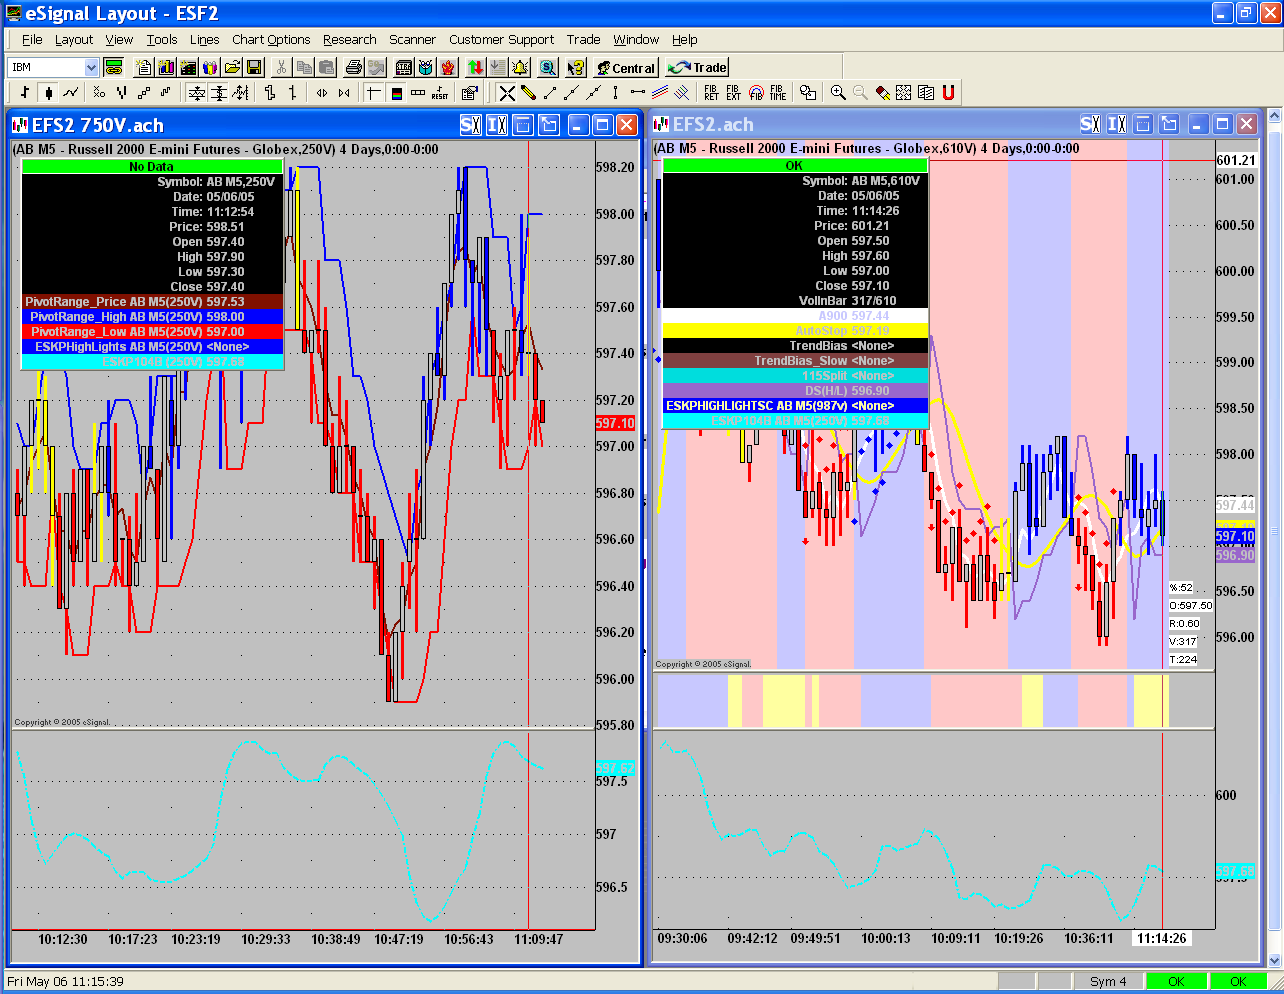
I have 610v chart and I am plotting an indicator that is using a time interval of 250v. The current bar on the 750v does not show the current value from the same indicator on a 250v chart. The value for the indicator on the 750v chart appears to match the values a few bars back on the 250v chart
It would appear that the indicator using the smaller time interval is being updated for every tick on the 750v chart. When a new bar is formed on the 750v is formed, the current value of the 250v is plotted and then never updated as the 750v bar is continued to be filled.
is this the way it is suppose to work? As the attached image shows, the values are out of synch.

Comment