Announcement

Collapse
No announcement yet.

displaying indicator with a smaller time interval than the chat time interval.

Collapse
X
 
  • Filter
  • Time
  • Show
Clear All
new posts

  • displaying indicator with a smaller time interval than the chat time interval.

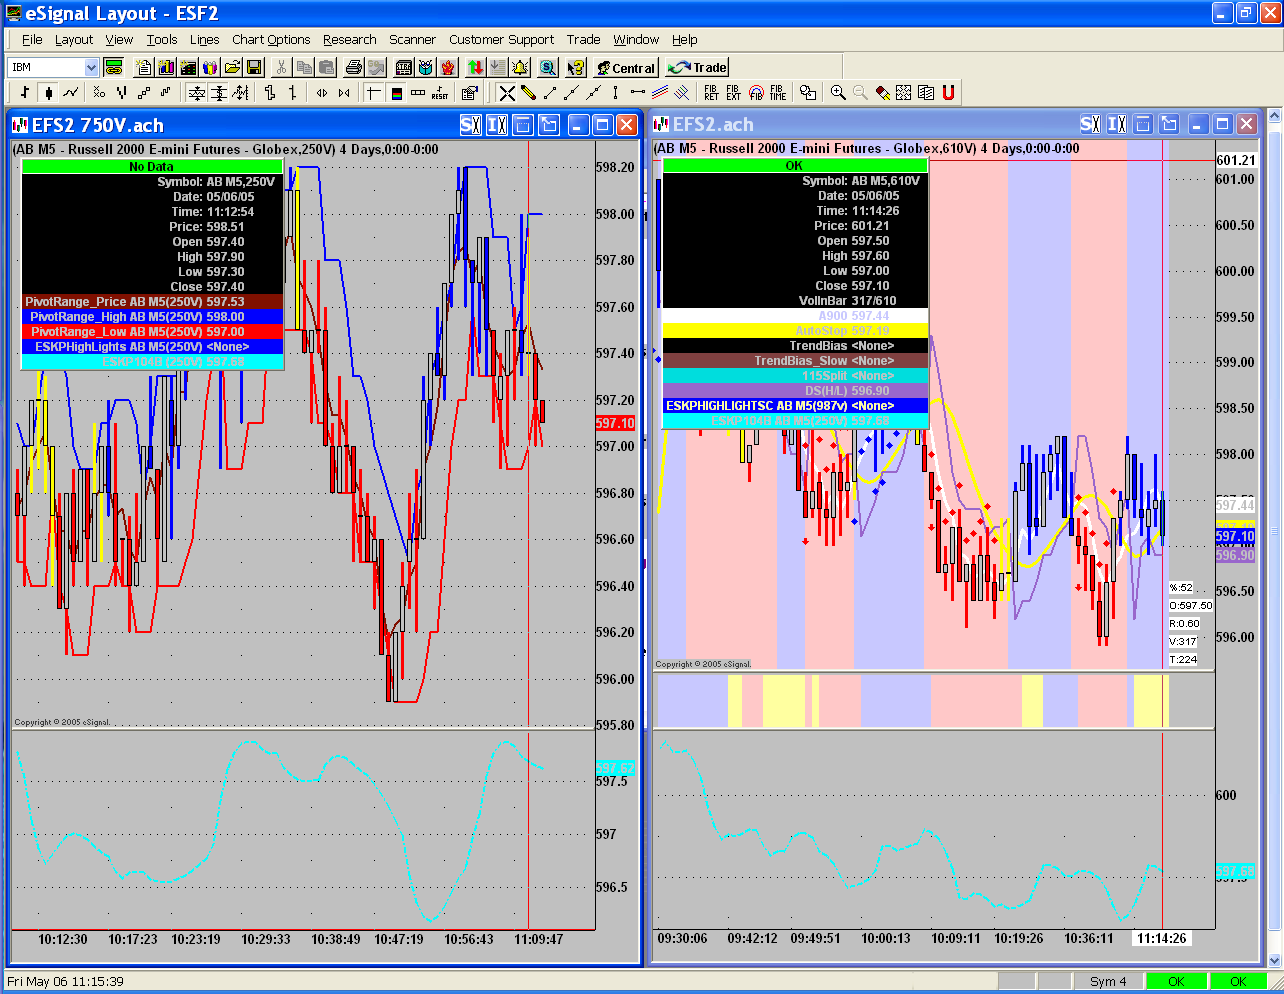
    I have 610v chart and I am plotting an indicator that is using a time interval of 250v. The current bar on the 750v does not show the current value from the same indicator on a 250v chart. The value for the indicator on the 750v chart appears to match the values a few bars back on the 250v chart

    It would appear that the indicator using the smaller time interval is being updated for every tick on the 750v chart. When a new bar is formed on the 750v is formed, the current value of the 250v is plotted and then never updated as the 750v bar is continued to be filled.

    is this the way it is suppose to work? As the attached image shows, the values are out of synch.
    Last edited by scjohn; 05-06-2005, 08:31 AM.

  • #2
    Update. when plotting an indicator in a subgraph that use a smaller timeframe than the chart interval. The value of the smaller indicator is what the indicator was at the beginning of the chart interval bar. The value of the smaller interval indicator is never update again for that bar. Internally, in EFS code, the correct value of the smaller time interval is correct.

    If the chart interval is 750v and the indicator in the subgraph is based on 250v. Then the value of the 250v indicator at the beginning of the 750V bars is used in the subgraph. The subgraph will not be updated again while the current 750v bar is being built.

    I would like to know is this is by design. I think that when a new 250v bar is completed then the value in the subgraph should be updated to reflect the new value.

    Comment


    • #3
      Hello scjohn,

      Your EFS2 observations are accurate. However, plotting a lower time-frame interval on a higher time-frame chart was not an expected operation. Its a topic of discussion for us at the moment. Just wanted to let you know we're looking into this.

      EFS1 did not have any time synchronization between intervals. It simply compared relative bar indexes between the intervals, which is why you saw the current values being compared on bar 0 prior to 7.9. Intra-day (minute-based) intervals should work as you're expecting. Tick-based intervals are displaying the values for the first bar in the lower time-frame interval, as you've described.
      Jason K.
      Project Manager
      eSignal - an Interactive Data company

      EFS KnowledgeBase
      JavaScript for EFS Video Series
      EFS Beginner Tutorial Series
      EFS Glossary
      Custom EFS Development Policy

      New User Orientation

      Comment


      • #4
        I am wondering what will happen when a totally different symbol is used in a subgraph. Let's say that AB M5 610v is the primary and in a sub graph I plot data using ES M5. How will the ES M5 data be aligned with the primary chart/interval?

        thanks

        Comment


        • #5
          Hello scjohn,

          In short, they are synched by time stamps from the main chart's symbol/interval.

          In regards to plotting a lower time-frame series on a higher time-frame chart, we've discussed this at length we're not sure what would be the most logical way to display the result. It doesn't seem to be logical to plot a lower interval on a higher time-frame chart. Perhaps you can tell us more about how this would be useful for you and what you would expect to be plotted.

          Using the lower time-frame data internally (i.e. no plotting) can be used in various ways, which has value. There's no question there. The way the synching routines work currently, the EFS can only plot one segment of the lower time-frame series for each of the higher time frame bars.

          Perhaps another angle we could take is to have you describe what end result you are trying to accomplish. There may be a better alternative we can suggest.
          Jason K.
          Project Manager
          eSignal - an Interactive Data company

          EFS KnowledgeBase
          JavaScript for EFS Video Series
          EFS Beginner Tutorial Series
          EFS Glossary
          Custom EFS Development Policy

          New User Orientation

          Comment


          • #6
            My general persepctive on this that some indicators have a greater built in lag than others. Now, on a longer time frame chart one would want to stay away from those indicators that have a long lag while paying more attention to those indicators that have a shorter lag. For a shorter time frame you want to do the opposite. Stay away from the real short lag indicators on your small time frame and use those indicators that have a longer lag. Sounds like Goldilocks and the three bears.

            My main time frame is the 610v. My higher time frame is 987v. In the higher time frame I look at indicators that do not have a lot of lag. My smaller time frame is 250v and I look at indicators that have a longer lag. So indicators from all three time frames must be in alignment to take the trade. The indicators in the smaller time frame tell me if a new trend has really begun while the indicators in the larger time frame helps to keep the indicators on the main time frame in the correct direction.

            I picked the indicators my running separate 250v, 610v, and 987v. Once I found the proper combination, I combined the 2 separate charts down to one chart with the 610v being the main chart and the 987v and 250v indicators plotted in there own subgraphs. This is where I noticed the problem.

            I hope this helps.

            Comment


            • #7
              Hello scjohn,

              Thank you for your detailed description on how you use multiple time-frames. However, what we're trying to answer is what to display on the chart when plotting the lower time-frame series. Can you describe for us what you would expect to see visually on the chart itself for the lower-time frame plot?
              Jason K.
              Project Manager
              eSignal - an Interactive Data company

              EFS KnowledgeBase
              JavaScript for EFS Video Series
              EFS Beginner Tutorial Series
              EFS Glossary
              Custom EFS Development Policy

              New User Orientation

              Comment


              • #8
                Hmmmmm. I guess the ideal would be to have the lower time frame value update in real time. In other words, always plot/display the current value. That way, upon completion of the bar using the chart interval, the indicator (smaller time frame) will be showing the correct value at the end of the main interval bar.

                A second option would be to update/display the value of the smaller interval upon completion of the smaller interval bar. If the smaller interval happens to be evenly divisible into the chart interval, all the better. If not, at least you will have closer alignment between the smaller interval and the chart interval.

                Comment


                • #9
                  Hello scjohn,

                  Originally posted by scjohn
                  Hmmmmm. I guess the ideal would be to have the lower time frame value update in real time. In other words, always plot/display the current value. That way, upon completion of the bar using the chart interval, the indicator (smaller time frame) will be showing the correct value at the end of the main interval bar.
                  That's how things work currently for intraday intervals. For tick intervals it's a different behavior, which creates the problem you originally described. Let's look at this issue from another angel. If you just want to display the last value of the lower time frame, why would the interval of the lower time frame series matter? We could just plot the series using the current chart interval and get the same result.


                  A second option would be to update/display the value of the smaller interval upon completion of the smaller interval bar. If the smaller interval happens to be evenly divisible into the chart interval, all the better. If not, at least you will have closer alignment between the smaller interval and the chart interval.
                  If the two time frames are not evenly divisible we have a new problem all together. In this case, which closing value should be displayed for the historical bars? For plotting purposes, we really wouldn't have an accurately synchronized plot. The closing value for the lower time frame plot would have to come from the bar before or just after the main chart's bar based on time stamps, which creates an unsynchronized plot in my mind. It just doesn't seem logical to me to plot the lower time frame series on a higher time frame chart. I would just use the lower time frame series data internally to base decisions of that data, but not plot it. To see the lower time frame chart I would open a second chart running on that interval and space the x-axis out to match the scale of the other chart for a visual reference.
                  Jason K.
                  Project Manager
                  eSignal - an Interactive Data company

                  EFS KnowledgeBase
                  JavaScript for EFS Video Series
                  EFS Beginner Tutorial Series
                  EFS Glossary
                  Custom EFS Development Policy

                  New User Orientation

                  Comment

                  Working...
                  X