Announcement

Collapse
No announcement yet.

A few questions on proper coding scenarios

Collapse
This topic is closed.
X
X
 
  • Filter
  • Time
  • Show
Clear All
new posts

  • A few questions on proper coding scenarios

    We are building an efs that displays the red dots in the chart (Chart #1) below by using the following code technique.

    PHP Code:
    drawShapeRelative(0high()+2Shape.CIRCLE""Color.RGB(0,128,0), Shape.BOTTOM); 
    This code sets the red dots when triggered by the EFS to show up 2 points above the bars high. Notice how the dots don't smoothly align like they do for the "Parabolic.efs" shown in Chart #2?

    We also don't want them to be set by a point ratio if possable for this does'nt appear right for securities..

    Our 1st question would be ... How to set the code so the red dots would align in a smoother conjunction like they do in the parabolic.efs chart? (Chart #2)

    Chart #1:


    Chart #2:


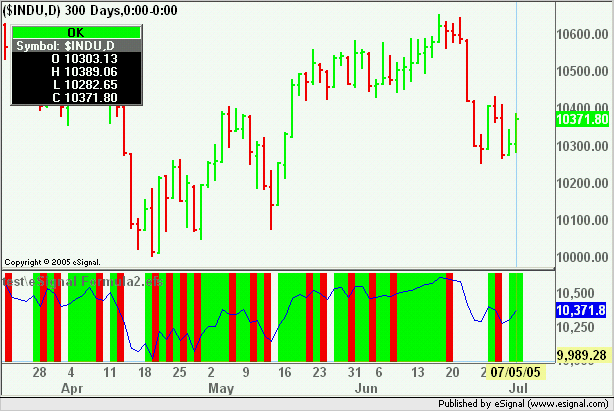
    Our second question is..... The lines (Green & Red) shown in the non-price study window in chart #3. We have the code set to a trigger which initiates the color line to appear, but instead of just having it appear for that "bar" we want it to fill continuously until
    the counter trigger is initiated. (just like Buy & Sell triggers)

    The colors would appear like they do in our un-professional drawn chart #4. Thus filling in the white spaces where the color should continue until the reverse trigger is initiated.


    Chart #3


    Chart #4


    Any help would be appreciated.
    Last edited by FibbGann; 06-30-2005, 06:25 PM.
    Excellent book on JavaScript for beginners

  • #2
    FibbGann
    With regards to the first question you could use a moving average of the High (or Low) plus/minus a constant to position the dots. For example

    PHP Code:
    drawShapeRelative(0sma(5,high(),0)+2Shape.CIRCLE""Color.RGB(0,128,0), Shape.BOTTOM); 
    As to the second question add a variable called for example vFlag which has two or three states ie 1 and -1 or 0, 1 and -1. When a signal is triggered set vFlag to any one of those states. Then set up a condition that checks the state of vFlag and paints the background accordingly.
    Alex

    Comment


    • #3
      Originally posted by Alexis C. Montenegro
      FibbGann
      With regards to the first question you could use a moving average of the High (or Low) plus/minus a constant to position the dots. For example

      PHP Code:
      drawShapeRelative(0sma(5,high(),0)+2Shape.CIRCLE""Color.RGB(0,128,0), Shape.BOTTOM); 
      Alex
      Thanks Alex!

      That works ok on the futures, but using it on stocks puts it way out of line.
      Excellent book on JavaScript for beginners

      Comment


      • #4
        FibbGann
        I just used +2 because that is the constant you had in your example. Replace 2 with 0.2 (or any value of your chosing) and you may get a more acceptable result
        Alex

        Comment


        • #5
          Thanks Alex we are close to what we wanted to accomplish.


          Excellent book on JavaScript for beginners

          Comment


          • #6
            Alex,

            Could you look at this code and tell me where I went wrong?
            I get no syntax errors and can't see where I may have goofed.

            The shapes do not appear.

            Attached Files
            Excellent book on JavaScript for beginners

            Comment


            • #7
              FibbGann
              1) In both Set1 and Set2 close(0) and open(0) are missing the brackets and bar index
              2) Set3 is redundant as it will never get verified because either Set1 or Set2 are going to enter a trade. I suspect you are trying to use Set3 to reset vFlag to 0 if not in a trade but that should be done in Set4 or Set5. You should remove Set3
              3) Using "while the following will happen only the first time" is redundant because you already have unique qualifiers when checking if Strategy.isInTrade()==false.in Set1 and Set2 and if Strategy.isLong/Short()==true in Set3 and Set4.
              4) Your Set4 and Set5 conditions never return true because vFlag cannot be equal to 0 while the Strategy is Long/Short. In fact vFlag is set to 1 or -1 by Set1 and Set2 respectively when the Strategy enters a trade. You can either remove the vFlag condition or check if it is set to 1 or -1. You should then set vFlag to 0 after the doCover and doSell commands are executed else no new trade will be entered.
              However in the context of this script vFlag does not appear to have any useful role so it could be removed from all conditions.
              Alex

              Comment


              • #8
                I was afraid that was how it was going to layout.

                The reason I did it that way with the flags was I wasn't aware of how to make SET1 and SET2 close out the trades when they were no longer true without using a counter strategy to close them.

                I.E. Strategy.doSell when Set1 (doLong) was no longer true

                I.E. Strategy.doCover when Set2 (doShort was no longer true

                Would this way work?

                First I have to fix the...

                1) In both Set1 and Set2 close(0) and open(0) are missing the brackets and bar index
                Then delete Sets 3,4 and 5.

                The start in Set 3 (blank) with the following code.

                if)
                strategy.islong() &&
                vFlag1 == false

                ... while the following will happen only the first time:

                Strategy.doSell

                And the same concept in Set4

                I guess what I am looking for is how to trigger the Strategy.doSell
                When Set1 is no longer true and the same for Set2 without having to inout a counter strategy to close out those positions.


                I was trying to to make it so the efs does go long and sell based on Set1, and then to do short and do cover for Set2 for I don't want to be ina a trade 100% of the time.


                Hope that was'nt to confusing.
                Last edited by FibbGann; 07-05-2005, 10:23 PM.
                Excellent book on JavaScript for beginners

                Comment


                • #9
                  Well I don't know what I was babling about below!

                  I guess my question is....

                  How would I code it to close out the positions if Set1 is no longer true and the same would go for Set 2?
                  Last edited by FibbGann; 07-05-2005, 10:41 PM.
                  Excellent book on JavaScript for beginners

                  Comment


                  • #10
                    FibbGann
                    The enclosed script should provide you with some examples you can use
                    Alex

                    PHP Code:
                    function preMain(){
                        
                    setColorPriceBars(true);
                        
                    setDefaultPriceBarColor(Color.black);
                    }

                    function 
                    main(){

                        var 
                    Cond1 close(0)>open(0);
                        
                        if(!
                    Strategy.isInTrade() && Cond1){
                            
                    Strategy.doLong("Long"Strategy.CLOSEStrategy.THISBAR);        
                        }
                        
                        if(
                    Strategy.isLong() && !Cond1){
                            
                    Strategy.doSell("Sell"Strategy.CLOSEStrategy.THISBAR); 
                            
                    setBarBgColor(Color.red);
                        }
                        
                        if(
                    Strategy.isLong()){
                            
                    setBarBgColor(Color.lime);
                        }
                        
                        if(
                    Cond1setPriceBarColor(Color.lime);
                        if(!
                    Cond1setPriceBarColor(Color.red);
                        

                        return 
                    close(0);

                    Comment


                    • #11
                      Help...

                      Fibb,

                      Alex has answered most of your questions already... I just thought I would throw in a few alternatives..

                      Regarding the DOTS..

                      Use three Moving averages to accomplish this task..
                      a. MA of the HIGHS
                      b. MA of the LOWS
                      c. MA of ((HIGH+LOW)/2) - or middle of the bars

                      Now, you can use these to create offsets for your dots..

                      for sell dots...
                      draw your dots at (a+Math.abs(a-c))

                      for buy dots..
                      draw your dots at (b-Math.abs(c-b))

                      Regarding your triggers, Alex has just about covered everything. If you need more help - let me know.

                      B
                      Brad Matheny
                      eSignal Solution Provider since 2000

                      Comment

                      Working...
                      X