Announcement

Collapse
No announcement yet.

MA Study syntax

Collapse
This topic is closed.
X
X
 
  • Filter
  • Time
  • Show
Clear All
new posts

  • MA Study syntax

    In the attached file I am attempting to get the MA values from two different time charts, but when I print the results, the values are identical. I'm using the format specified in the Developer's Reference, and except for adding a necessary comma that isn't specified, I think I have it correct.

    Any help is greatly appreciated,
    Greg
    Attached Files

  • #2
    Greg
    sma(5,"hl2", inv(5)); should be sma(5,hl2(inv(5)));
    Alex

    Comment


    • #3
      Thanks Alex.

      Comment


      • #4
        Hi Alex,

        Another question about that code. Why is it that after the initial agreement of the two MAs draw the appropriate color, the value keeps changing to no-agreement, even during a trending period? I mean that picking a steady trend where both MAs are clearly pointed in the same direction for an hour or more, I am getting lime then yellow then lime then yellow, etc. How to fix this?

        Thanks,
        Greg

        Comment


        • #5
          Greg
          To understand the reasons behind the behavior you are seeing you need to appreciate what actually happens as you compute studies based on multiple time frames.
          To illustrate this I will use a simple 3 period moving average based on 15 minute data and plotted on a 1 minute chart. Following is the first version of the study I will be using.

          PHP Code:
          function preMain(){
              
          setPriceStudy(true);
              
          setStudyTitle("sample");
              
          setCursorLabelName("Avg");
          }
           
          var 
          Avg null;
           
          function 
          main(){
              if(
          Avg == nullAvg sma(3,inv(15));
           
              return 
          Avg.getValue(0);//in this case I am returning the value

          Create two charts one for 15 minute (to use as a comparison) and the other for 1 minute and in each one load the efs.

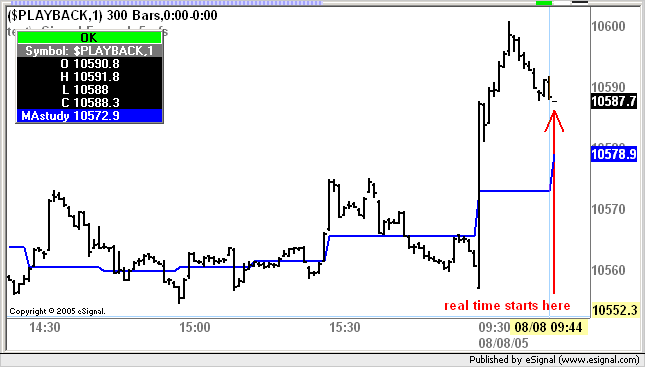
          As you first load this script on the 1 minute chart you will see that on historical bars there is a single value plotted across each group of the fifteen 1 minute bars that make up the corresponding 15 minute interval. This is because on historical bars the value of the average on the 15 minute interval is a single data point. The efs engine has no way of knowing how within any 15 minute bar the average evolved. All it knows at this time is the value of the average when the 15 minute bar closed and it uses that value across all fifteen 1 minute bars thereby syncronizing the plots across multiple intervals (see following image).

          Important Note: Although this is the value of the average at the close of the 15 minute interval that value is "known" on historical bars from the first bar of the fifteen 1 minute bars that correspond to the same interval. In other words the value of the average you see plotted for example at 9:30 on the 1 minute chart is actually the value of the average as it will be at 9:44. This a key factor to consider when back testing


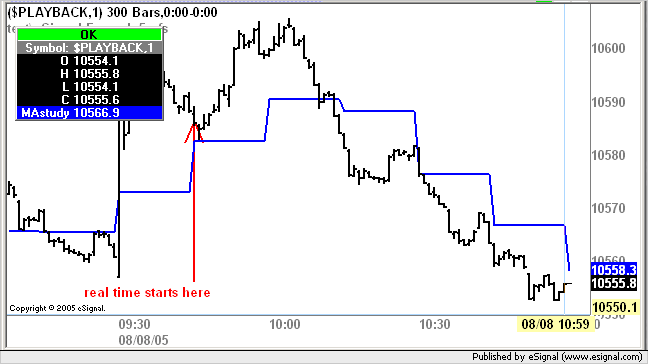
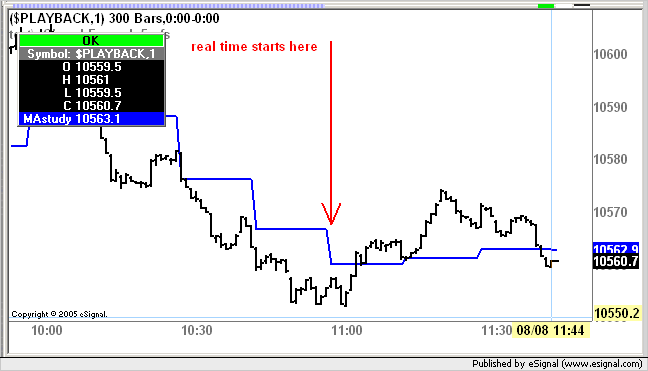
          As you run the same efs in real time you will now see that at every 1 minute bar the plot is no longer a straight line. This is because the efs is displaying the value of the 15 minute average (which is being recalculated on every tick) at the moment each new 1 minute bar is completed.


          If at this point you reload the efs you will see that the jagged line now becomes a straight line across each group of fifteen 1 minute bars for the reasons explained above (ie single data point on historical bars).


          The efs2 engine however offers you a way to maintain complete synchronization even in real time on each 1 minute bar ie it can adjust the prior values of the average within the same group of fifteen 1 minute bars.
          To do this you need to plot the series instead of the value. Here is the same efs written to take advantage of this feature

          PHP Code:
          function preMain(){
              
          setPriceStudy(true);
              
          setStudyTitle("sample");
              
          setCursorLabelName("Avg");
          }
           
          var 
          Avg null;
           
          function 
          main(){
              if(
          Avg == nullAvg sma(3,inv(15));
           
              return 
          getSeries(Avg);//in this case I am returning the series

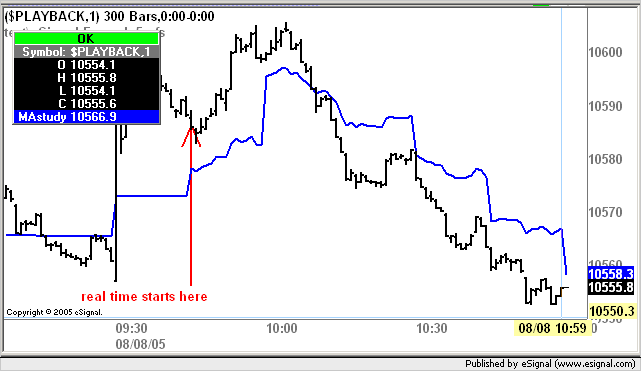
          Run this in real time and you will see that the average plots as a straight line for the group of 1 minute bars corresponding to the current 15 minute interval. The price that is being plotted is that of the current value of the average on the 15 minute chart. As new 1 minute bars are plotted and the average changes in value the efs engine readjusts the prior plot on the 1 minute chart.


          However if you set conditions based on the values of the studies that are being calculated in real time you may get some signals that are true at the moment in which they occurr but that when the 15 minute bar will close may no longer be true. More importantly those conditions cannot be replicated on historical bars (when you reload the efs for example) for the reasons explained above.

          Therefore if you are generating signals based on multiple time frames you should always consider using completed bars else you will get false signals in real time or incorrect results in back tests (because they are forward looking).
          Using completed intervals will instead ensure that real time and historical signals match
          Hope this helps
          Alex

          Comment

          Working...
          X