Announcement

Collapse
No announcement yet.

Day session OHLC

Collapse
X
 
  • Filter
  • Time
  • Show
Clear All
new posts

  • #16
    Alex,

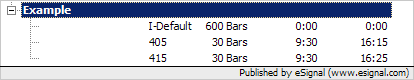
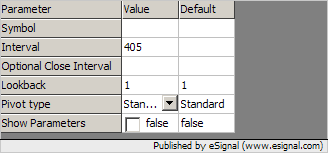
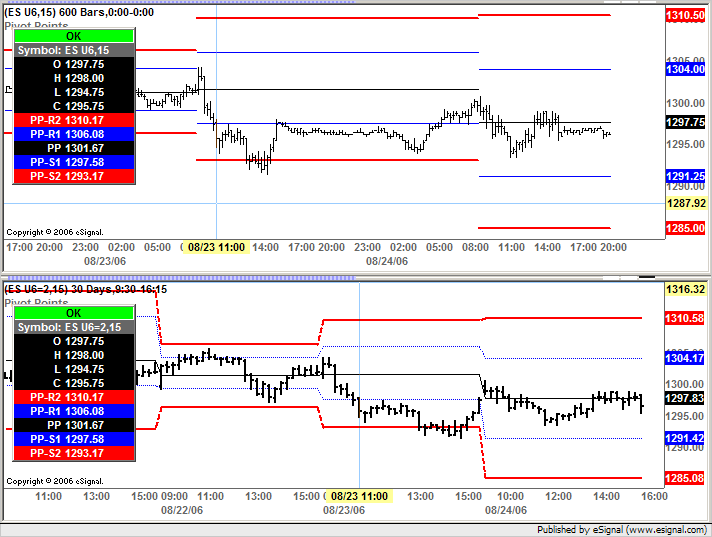
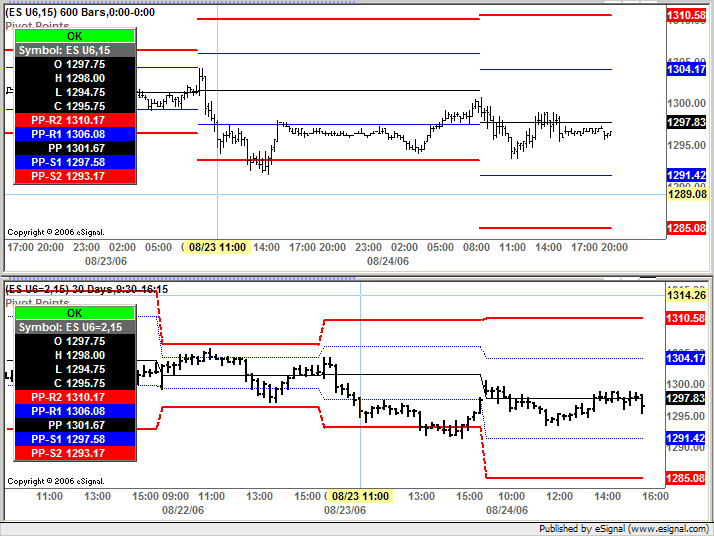
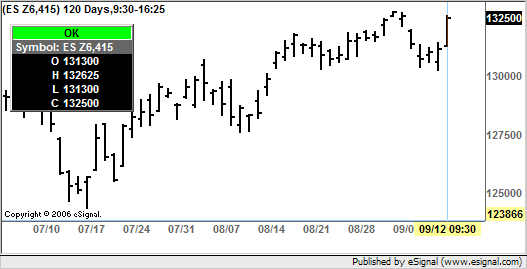
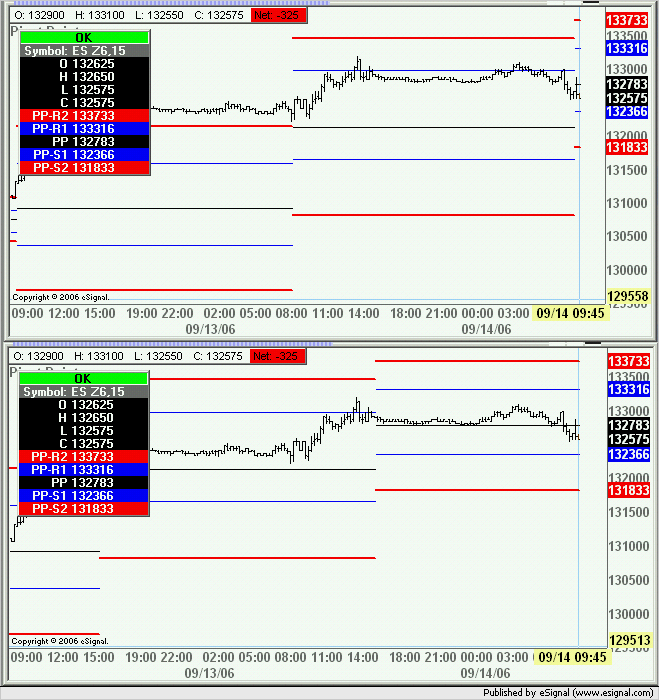
    I am new to EFS programming. I studied the PivotPointsAll2 efs but can't determine how to make it work in our situation. We monitor and trade ES, NQ, YM and AB on the 24 hour time template, but would like the option to display only pivots calculated on RTH. Is this possible?

    Thanks

    TR

    Comment


    • #17
      TR
      Here is what you would need to do.
      In the Time Template add two User Defined intervals one set to 405 with Start/End Times of 9:30/16:15 and the other to 415 with Start/End Times of 9:30/16:25


      Load the PivotPointAll2 efs in the chart and in Edit Studies insert 405 in the Interval parameter


      In the top chart shown in the next image you can see a 24 hour plot of ES U6 with the pivots based on the RTH ie 9:30-16:15. In the bottom chart you can see the RTH session using ES U6=2 with the PivotPointAll efs which is available in the Pivots folder.


      As you can see there can be at times a slight difference between the values of the pivots in the two charts (see the values in the price scale). This is because when using the 405 minute interval the simulated daily Close is actually the last trade of the day and does not include the Settlement which is instead taken into consideration when the pivots are based on the actual daily data.
      If you prefer that the pivots include the Settlement then set the Interval parameter to 415


      The result of this change is shown in the following image.


      The pivots now match in the two charts. This is because the Settlement is now included in the calculation by virtue of the extra 10 minutes added to the simulated daily interval
      Alex

      Comment


      • #18
        Alex,

        Thanks. This helps a lot.

        TR

        Comment


        • #19
          TR
          You are most welcome
          Alex

          Comment


          • #20
            I have been testing the intraday and they are working great. I was wondering how do you control when the chart starts to display the new lines? Currently it switches from yesterday to today's pivots at 9:30 am. Is it possible for the new data to plot at midnight, for example?

            Comment


            • #21
              gatorguy
              If you are using 405 or 415 minutes interval (with the Time Template set to Start/End at 9:30/16:15 or 16:25) to determine the pivots then 9:30 will be the time from which the new pivots will be calculated.
              Assuming I understood your question correctly the formula will not plot the new pivots at midnight since they are not yet calculated at that time.
              Alex

              Comment


              • #22
                I am using the 405 and 415 minutes interval. Since the data is available from yesterday, I do not understand why the new pivots can't be calculated prior to start of session. I probably do not thoroughly understand the user defined time template. Is there any available documentation that can provide more detail for the time template?

                Comment


                • #23
                  gatorguy
                  As is the formula references the prior bar (ie bar index -1) to calculate the pivots.
                  If you use 405 or 415 minute bars set to Start/End at 9:30/16:15 (or 16:25) then yesterday's bar will not be at bar index -1 until today's bar starts plotting at 9:30.
                  The enclosed screenshot of a 415 minute bar chart [which is what the formula references] was taken today (09/13/06) before 9:30 and as you can see yesterday's (09/12/06) bar is still the current bar (ie bar index 0) at this time. Once today's bar will start plotting at 9:30 then the formula will be able to reference yesterday's bar because at that point it will be the prior bar (ie bar index -1).
                  For information on Time Templates see this article in the eSignal KnowledgeBase and this training video
                  Alex

                  Comment


                  • #24
                    gatorguy
                    Here is a way to modify the efs so that once the new trading session begins at 16:30 it calculates and plots the new pivots even if "yesterday's bar" is still the current one (ie at bar index 0). Open the PivotPointAll2 formula and replace the following block of code in lines 118-120
                    PHP Code:
                    var vHigh  xHigh.getValue(-Lookback);
                    var 
                    vLow   xLow.getValue(-Lookback);
                    var 
                    vClose xClose.getValue(-Lookback); 
                    with the following
                    PHP Code:
                    if( Type=="Standard" && (Interval==405 || Interval==415) &&
                            ((
                    hour(0)*100)+minute(0)<930 || (hour(0)*100)+minute(0)>=1630) ){
                                var 
                    vHigh  xHigh.getValue(0);
                                var 
                    vLow   xLow.getValue(0);
                                var 
                    vClose xClose.getValue(0); 
                        } else {    
                            var 
                    vHigh  xHigh.getValue(-Lookback);
                            var 
                    vLow   xLow.getValue(-Lookback);
                            var 
                    vClose xClose.getValue(-Lookback); 
                        } 
                    With this modification in place if you now use the 405 or 415 minute interval and the bar time is between 16:30 and 9:30 the formula will reference the current bar to calculate the pivots else it references the prior bar. The pivots will plot starting from 16:30 ie at the beginning of the new session (see the screenshot enclosed below that compares the original plots to the modified ones)
                    Note that this modification will only work with the "Standard" pivots. Further changes would be required to adapt the logic to the "Woodie" or "DeMark" pivots.
                    Alex

                    Comment


                    • #25
                      Thanks Alex. I will implement this and keep track of how well it works.

                      I looked at the references on time templates, but they are not very detailed. Is there any info for efs programmers, not users, on how the changes to options (like time templates) impact the code? Like an "Internals" document?

                      gatorguy

                      Comment


                      • #26
                        gatorguy
                        I am not aware of any documentation regarding Time Templates other than the one I indicated
                        Anyhow all a Time Template does is define the start/end times and the number of days or bars loaded for each interval specified in that template.
                        Any interval that is called by an efs through the inv() or sym() functions will use the definitions provided in the Time Template that is loaded in the chart in which the efs is running.
                        Alex

                        Comment


                        • #27
                          Alex,

                          I was running the PivotPointAll2 efs with the modifications you recommended. I started at about 8:30 AM and the pivots looked good. However, at 9:30, they reverted back to the pivots from the previous day. Then at 13:00, they reverted back to the correct pivots for today.

                          The options I used were time template of 415 and 415 in the input.

                          I am attaching a snapshot of the chart.

                          Any ideas?

                          gatorguy
                          Attached Files

                          Comment

                          Working...
                          X