Announcement

Collapse
No announcement yet.

Is Esignal capable of this?

Collapse
X
 
  • Filter
  • Time
  • Show
Clear All
new posts

  • Is Esignal capable of this?

    I subscribe to paper charts, as I have been updating them for years. I dont have the time nor the desire anymore to update them because of modern technology (its automatic)

    Anyway I want to know if E-SIGNAL is capable of putting dark dots over the Friday closing price on a daily chart?
    I want the dots only to appear on the closing price for Friday. It helps my eyes. And makes this closing price stand out for me.

    If anyone knows how to program this into Esignal let me know, the customer service said it was capable, and they said to post it to the Bulletin Board, if anyone can help, I would appreciate it greatly.

    Thanks!
  • #2
    cv989,

    Yes, that is possible with a fairly simple efs.

    Comment


    • #3
      Hello cv989,

      This can be accomplished with an EFS formula. To begin learning how to code EFS formulas, please visit our EFS KnowledgeBase. You may want to start with the Guide to Developing EFS Indicators.

      Once you understand the basics, you would then use the date object returned by getValue("time"). The Date Object has a getDay() method that will retrieve the day of the week from each bars' date. The value of 5 corresponds to Friday.

      In main, create the date object using the following.

      PHP Code:
      var dBarDate getValue("time"); 
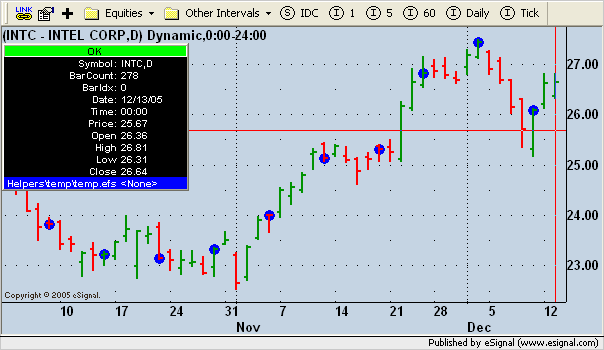
      Then create a conditional if() statement to identify all of the Friday bars. When the condition evaluates to true, then use the drawShape() function to draw a circle above the bar.

      PHP Code:
      if (dBarDate.getDay() == 5) {
          
      drawShape(Shape.CIRCLEAboveBar1Color.blue);

      You should end up with a chart that looks like below.
      Jason K.
      Project Manager
      eSignal - an Interactive Data company

      EFS KnowledgeBase
      JavaScript for EFS Video Series
      EFS Beginner Tutorial Series
      EFS Glossary
      Custom EFS Development Policy

      New User Orientation

      Comment


      • #4
        Great!
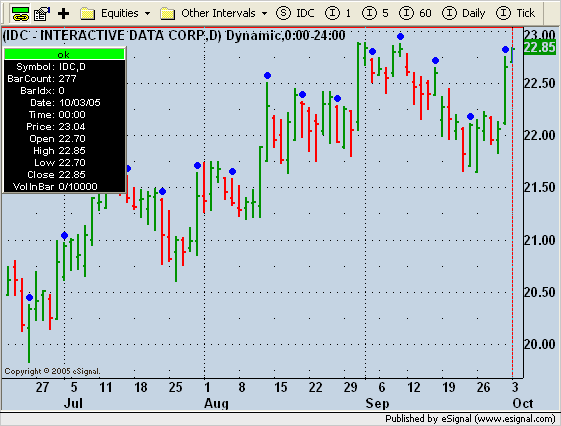
        This is similar to what I want, I know this might seem picky, but anyway to have that dot be directly over the closing price, vs above the bar? If the daily bar had a larger high, and lower close price, it will affect how the chart will look.

        Sorry to be a pain.

        Thanks for the input I will read the EFS link you provided, and get familiar with it.

        Comment


        • #5
          Hello cv989,

          No problem. Just replace the drawShape() call with drawShapeRelative().

          PHP Code:
          drawShapeRelative(0close(0), Shape.CIRCLEnullColor.blueShape.ONTOP); 
          Jason K.
          Project Manager
          eSignal - an Interactive Data company

          EFS KnowledgeBase
          JavaScript for EFS Video Series
          EFS Beginner Tutorial Series
          EFS Glossary
          Custom EFS Development Policy

          New User Orientation

          Comment


          • #6
            JasonK-
            Thanks for your help. I will give this a try.

            Also if I want to modify where the dots are placed, and put dots on the monthly closing price of every month in addition do I just change the time period?

            Will esignal adjust to days that aren't traded and also the different time periods in a month?

            Let me know.

            Thanks

            Comment


            • #7
              Hello cv989,

              Originally posted by cv989
              JasonK-
              Thanks for your help. I will give this a try.

              Also if I want to modify where the dots are placed, and put dots on the monthly closing price of every month in addition do I just change the time period?

              If I understand correctly, you want to have (on the daily chart) another dot on the last daily bar of the month in addition to the Friday dots? In this case all you need to do is add another condition that draws a separate series of dots. I wouldn't put the monthly series at the closing values, however. If that bar happens to also be a Friday, it will overlap the Friday dot.

              To establish two unique sets of dots, you'll need to utilize the optional TagName parameter to keep the two sets from overwriting each other. First create a couple global counters outside of main.

              PHP Code:
              var nFridayCntr 0;
              var 
              nMonthlyCntr 0;

              function 
              main() {
                   
              // your formula code

              Then add as the last parameter to your current drawTextRelative() function a tag name in the following format.

              "Friday"+nFridayCntr

              Right after the drawTextRelative() call, increment the global counter variable, nFridayCntr, by a value of 1. But only allow this to increment once for that bar. To prevent the variable from incrementing once for each trade during real time processing, put the increment routine inside a check for BARSTATE_NEWBAR.

              PHP Code:
              if (getBarState() == BARSTATE_NEWBARnFridayCntr += 1
              For the monthly dot condition, the easiest thing to do is check to see if the current daily bars month value is different than the previous daily bar. This is the trigger that tells you that you're currently processing the first daily bar for the month. Then call drawTextRelative() using a tag name series for monthly dots and increment the monthly global counter. Also, very important, draw this series of dots on bar -1. This will put the monthly dot on the last daily bar for the previous month.

              PHP Code:
              if (month(0) != month(-1)) {
                   
              drawShapeRelative(-1high(-1), Shape.CIRCLEnullColor.yellowShape.ONTOP"Month"+nMonthlyCntr);
                   if (
              getBarState() == BARSTATE_NEWBARnMonthlyCntr += 1;

              Will esignal adjust to days that aren't traded and also the different time periods in a month?

              Let me know.

              Thanks
              eSignal does not display days or bars where there was no trading activity. Hope that answers your question.
              Jason K.
              Project Manager
              eSignal - an Interactive Data company

              EFS KnowledgeBase
              JavaScript for EFS Video Series
              EFS Beginner Tutorial Series
              EFS Glossary
              Custom EFS Development Policy

              New User Orientation

              Comment


              • #8
                JasonK-
                OK I should have been more specific in my reply. This does happen quite a bit, when the Friday closing price is also the monthly closing price, I use a pencil and circle the monthly closing price on my paper charts, I will try to scan in a chart and post it here so that you can see what I am talking about.
                But I think I am going to be able to use Esignal to get what I want.

                I need to have the monthly closing price circled, this way if it does fall on a Friday, I will be able to see both with my eyes very quickly.

                Hopefully this makes sense, sorry had 2 cups of starbucks this AM and its not even 10:AM
                Thanks!

                Comment


                • #9
                  Hello cv989,

                  The only reason I suggested a different location for the monthly dot, is because it's difficult to see two different images that are drawn at the same location. We don't have a size parameter for the circles, which is what you would ideally need. You could try drawing different shapes for the two series of dots. For example, draw squares for the Friday dots and diamonds for the monthly. That way, on the common bars you would be able to tell that there is an overlap. The other thing you could do, which you might like better anyway, is to use drawLineRelative(). By using the same x/y coordinate for both x/y pairs you end up with a dot. The drawLineRelative function also has a thickness parameter. You can play with that parameter to create the affect of a larger circle. However, it creates a solid circle. As long as you use the drawShape call for the Friday dots after you call the drawLine function for the monthly dots, the Friday dots should appear on top of the larger monthly dot. Give it a shot. If you run into some trouble, post your code.
                  Jason K.
                  Project Manager
                  eSignal - an Interactive Data company

                  EFS KnowledgeBase
                  JavaScript for EFS Video Series
                  EFS Beginner Tutorial Series
                  EFS Glossary
                  Custom EFS Development Policy

                  New User Orientation

                  Comment


                  • #10
                    JasonK
                    What about if we use a circle but not a colored in circle, just a normal circle around the monthly closing price, This way if the end of month closing price happens to fall on a Friday, the dot for the Friday close will appear, and then then the monthly close will be a circle around the dot? the circle just wont be shaded or colored in..

                    I know I keep dragging this on for you, (sorry...;-)
                    But I need the same look for the electronic version as the paper charts have been providing for years.

                    Comment


                    • #11
                      Hello cv989,

                      From my previous reply:

                      The other thing you could do, which you might like better anyway, is to use drawLineRelative(). By using the same x/y coordinate for both x/y pairs you end up with a dot. The drawLineRelative function also has a thickness parameter. You can play with that parameter to create the affect of a larger circle. However, it creates a solid circle. As long as you use the drawShape call for the Friday dots after you call the drawLine function for the monthly dots, the Friday dots should appear on top of the larger monthly dot.
                      This method will create the effect you just described. The Friday dot will end up with an outline effect. Give it a shot. If you run into some trouble, post your code.
                      Jason K.
                      Project Manager
                      eSignal - an Interactive Data company

                      EFS KnowledgeBase
                      JavaScript for EFS Video Series
                      EFS Beginner Tutorial Series
                      EFS Glossary
                      Custom EFS Development Policy

                      New User Orientation

                      Comment


                      • #12
                        Jason -
                        Perhaps I am not as EFS savy as I would like to be, but I am having a heck of a time generating the EFS. After reading the links you have provided I cannot seem to do what you say. I am now trying the formula wizard, and not getting the getValue("time")


                        var dBarDate = getValue("time");
                        if (dBarDate.getDay() == 5) {
                        drawShapeRelative(0, close(0), Shape.CIRCLE, null, Color.blue, Shape.ONTOP);
                        }

                        I will post my code so far, for you to review if you could check it out?

                        Comment


                        • #13
                          Hello cv989,

                          The code snippet you posted should be working. Post your entire formula as an attachment and I'll take a look.

                          Jason K.
                          Project Manager
                          eSignal - an Interactive Data company

                          EFS KnowledgeBase
                          JavaScript for EFS Video Series
                          EFS Beginner Tutorial Series
                          EFS Glossary
                          Custom EFS Development Policy

                          New User Orientation

                          Comment


                          • #14
                            Jason -
                            I load the EFS and I get this:


                            EFS error
                            dbardate is not defined systax check line 35:ReferenceError: dbardate is not defined

                            Syntax Check line 1: getValue() can only be called in Main()
                            LIne 35: syntaxError
                            var dbarDate = getValue (time)==5

                            I load the other one and i get output below the chart.

                            Any help is appreciated. Again sorry for all the questions the EFS is new to me....

                            Comment


                            • #15
                              I am attempting to get the circles working over the Friday closing price, along with the Monthly Closing price as a circle as we discussed over the Fridays closing price as a larger circle, using the relative circle.
                              I posted the EFS for your review.
                              Last edited by cv989; 12-14-2005, 06:43 AM.

                              Comment

                              Working...
                              X