Announcement

Collapse
No announcement yet.

time inside time quandry

Collapse
X
 
  • Filter
  • Time
  • Show
Clear All
new posts

  • time inside time quandry

    I am looking to mark an event based on a study.
    Attached is current attempt - problems arose when I switched time frames...
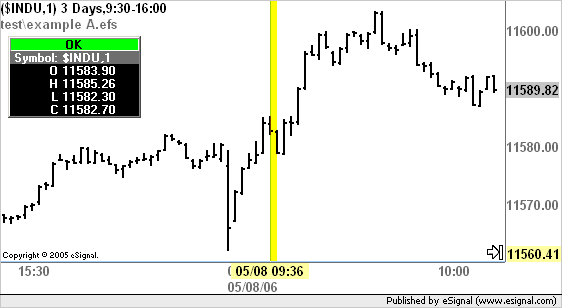
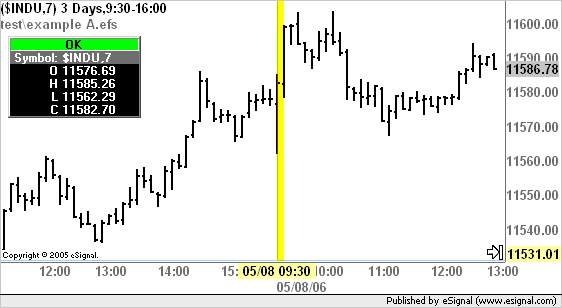
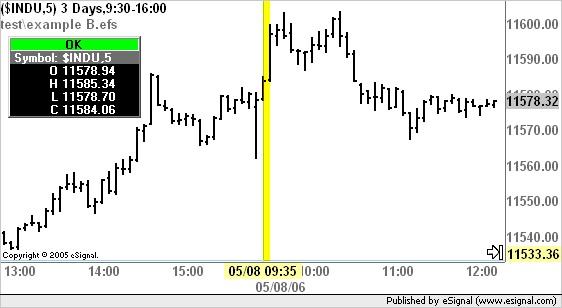
    Gist of study is to look at 1 minute SPY's for contraction of Bollinger bands. When the threshold is reached, draw a symbol on current chart, however I believe the logic I have used may use only the 1 minute portion in the closing of whatever the principle time frame of the current chart is.
    Any suggestions as to how evalution of smaller (1 minute, on each bar) time frame can be accomplished inside scope of what ever time frame the chart is in?
    Thanks

  • #2
    cfra
    FYI there is no attachment with your post. You may want to try posting again
    Alex

    Comment


    • #3
      The attachement:

      /************************************************** *******
      PUT ALERT ON PRICE CHART - trigger alert
      ================================================== =====
      History
      VERSION 1 - 6 May
      V2 - try to make compatible with any time frame less than day

      ************************************************** ********/


      var vBBu = null;
      var vBBl = null;
      var bInit = false;
      var x = 0;

      function preMain() {
      setPriceStudy(true);
      setStudyTitle("Mark-5");
      setShowTitleParameters(false);

      var fp1 = new FunctionParameter("Length", FunctionParameter.NUMBER);
      fp1.setLowerLimit(1);
      fp1.setDefault(20); //Edit this value to set a new default

      var fp2 = new FunctionParameter("StdDev", FunctionParameter.NUMBER);
      fp2.setLowerLimit(0);
      fp2.setDefault(2); //Edit this value to set a new default

      var fp3 = new FunctionParameter("Source", FunctionParameter.STRING);
      fp3.setName("Source");
      fp3.addOption("Close");
      fp3.addOption("High");
      fp3.addOption("Low");
      fp3.addOption("Open");
      fp3.addOption("HL/2");
      fp3.addOption("HLC/3");
      fp3.addOption("OHLC/4");
      fp3.setDefault("Close"); //Edit this value to set a new default

      var fp4 = new FunctionParameter("offset", FunctionParameter.NUMBER);
      fp4.setName("Alert offset");
      fp4.setLowerLimit(0);
      fp4.setDefault(.5);
      }

      function main(Length, StdDev, Source, offset) {


      if (bInit == false){
      vBBu = new upperBB(Length, StdDev, sym("SPY"), inv(1));
      vBBl = new lowerBB(Length, StdDev, sym("SPY"), inv(1));
      bInit = true;
      }

      var y = (vBBu.getValue(0) - vBBl.getValue(0));


      if(y <= .5){
      drawImageRelative(0,high(0) + offset,"SystemHappyFace", null, Image.TOP, x);
      x++;
      }

      return ;
      }

      Comment


      • #4
        cfra
        The syntax used in the upperBB() and lowerBB() functions is incorrect. Should be
        vBBu = upperBB(Length, StdDev, sym("SPY,1"));
        vBBl = lowerBB(Length, StdDev, sym("SPY,1"));

        For a detailed series of examples on how to use sym() and inv() see this thread.
        Also you do not need to use the new constructor with EFS2 functions.
        Alex

        Comment


        • #5
          Thanks for the correction.
          Any insights on the time issue?

          Comment


          • #6
            cfra
            Not sure I understand what the issue is
            Alex

            Comment


            • #7
              I will see if I can explain better.
              When I execute the current study on a 1 minute time frame I get a certain result, as in on a 1 minute chart of ??? I will get results x,y & z.
              If I change the time frame of the underlying chart to 5 minutes and reload the study I get the results a,b & c. And the same in true for most any time you choose - all different results.
              It appears as through even though the time frame for the 'indicator' inside the study remains the same (the "SPY,1"), the manner in which the study is executed is somehow affected by the time frame of the chart.
              My expectation of this study would be to see the same result (i.e. when the BBands on the "SPY,1" squeeze together - an image gets drawn on bar(0)) , regardless of the time frame selected for the underlying chart.

              Thanks.

              Comment


              • #8
                cfra
                Assuming I understood your explanation correctly what you are seeing is to be expected on historical bars because if you are using a chart interval that is higher than the one on which the study is based then the efs engine has no way of showing you what occurred "inside" any specific bar. As it uses only one data point to synchronize the higher and lower intervals it will refer to the last 1 minute bar within the higher interval's time segment. Only if the condition occurrs on that last 1 minute bar of the equivalent higher interval segment will it then draw the corresponding shape. This explains why you are seeing different results when changing chart intervals.
                To accomplish what you want on historical data you will have to loop (on each bar of the chart) through all the lower interval bars that make up the higher interval segment.
                In order to explain this process assume that we have the following efs which will paint in yellow the background of any bar that is time stamped 9:36. The study uses the hour() and minute() functions which can be based on a specific interval through the inv() function.

                PHP Code:
                function preMain(){
                    
                setPriceStudy(true);
                }
                function 
                main(){
                    if((
                hour(0,inv(1))*100)+minute(0,inv(1))==936)
                        
                setBarBgColor(Color.yellow);
                    return;

                For the purpose of this example create a Time Template with Intraday Default Start/End times of 9:30-16:00 and set to load at least 3 Days of data (see following image)


                Apply the Time Template to the chart and set the chart interval to 1 minute. Then load the efs enclosed above.
                You will see that the background of each bar time stamped 9:36 will be painted in yellow.


                Now switch the chart interval to 5 minutes. You will no longer see any background painted because there is no 1 minute bar time stamped 9:36 that is the last bar of any 5 minute segment.
                Now switch to a 7 minute chart interval and you will see that the 9:30 bar's background is painted yellow. This is because the 1 minute bar time stamped 9:36 is the last bar of the 7 minute interval.


                In order to "look inside" the higher interval you need to loop through the equivalent number of 1 minute bars that make up that higher time segment.
                Here is a simple example for use with a 5 minute chart. Note that on every 5 minute bar I loop through the prior five 1 minute bars.

                PHP Code:
                function preMain(){
                    
                setPriceStudy(true);
                    
                setShowCursorLabel(false);
                }
                function 
                main(){
                    if(
                getBarState()==BARSTATE_NEWBAR){
                        for (var 
                i=0i<5i++){
                            if((
                hour(-i,inv(1))*100)+minute(-i,inv(1))==936)
                                
                setBarBgColor(Color.yellow);
                        }
                    }
                    return;

                And in fact you can now see that the 5 minute chart will display the yellow background on the 9:35 bar which is the one that contains the 1 minute bar time stamped 9:36.


                Note that all the above is required on historical bars only. In real time (ie on the current bar) your efs will provide you with the signals you expect to see which will be triggered by the study based on the 1 minute data of SPY.
                Alex

                Comment


                • #9
                  Many thanks - this resolves a number of issues that have affected my coding efforts.

                  Comment

                  Working...
                  X