Announcement

Collapse
No announcement yet.

Ticki Extemes and the $tick

Collapse
X
 
  • Filter
  • Time
  • Show
Clear All
new posts

  • Ticki Extemes and the $tick

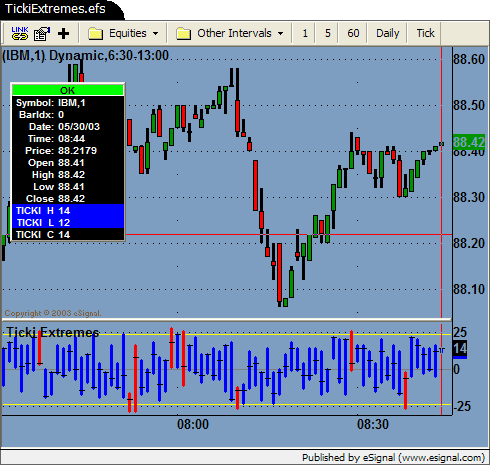
    I downloaded the Ticki Extremes indicator and was wondering what is the source data. The Tiki is released from the NYSE every x amount of seconds during TRADING hours for the NYSE. SO how come I am getting tiki data all night in the after hours.

    The other thing is that if the TICKI EXtremes indicator is getting it's data from the night sesion data then what data exactly.

    The one thing I can say is I have been searching for a $tick indicator and downloaded one from this post - but it's in histogram format. That doesnt show the extremes of the reading for the time period selected.

    What I need is a bar chart form of $tick - or the same format as the Tickiextremes - with the little black mark to show where it closed for that bar period.

    If enyone can help That whould be greatly appreciated.
    Graham

  • #2
    Hi,
    I'm not exactly sure what your after, but you can display an advanced chart of the $TICKI in bar/candle format.
    Paul

    Comment


    • #3
      Thanks Turlies
      But I need a lower window indicator - so I could have a chart of say the s&p on the top and underneath have a $tick indicator. The $tick indicator would need to be just like the prebuilt Ticki extreme indicator that I found on this forum.
      Mabey that clears up my dilema a little
      Graham

      Comment


      • #4
        Hello Graham,

        I made some changes to the TickiExtremes.efs formula today. Take a look at the new version and let me know if this works for you.

        In regards to the night session data, the formula executes on every tick and will return the last valid price for $Ticki. The price is most likely from the last trade during its regular trading hours. Your data should look like a flat line. Is that what you are seeing? If not, perhaps you could post an image of your chart here tonight.

        Jason K.
        Project Manager
        eSignal - an Interactive Data company

        EFS KnowledgeBase
        JavaScript for EFS Video Series
        EFS Beginner Tutorial Series
        EFS Glossary
        Custom EFS Development Policy

        New User Orientation

        Comment


        • #5
          I'm going to give this a whirl as well.

          Suggestion: would it be possible to put a TICKI extreme dot on the price bar if slaved to an e-mini candlestick chart? I mean, a green dot if it hits +22, two green dots for +26, one red dot for -22, two red dots for -26, etc. Something like the way the Parabolic SAR is done.

          Great stuff eSig!

          Comment


          • #6
            Try this for the first ticki dot at +/- 22!!

            Attached Files

            Comment


            • #7
              Jason,
              Thanks for the time - I appreciate it much... but what I'm trying to say, I must be saying it wrong - I'll give it another try :

              The tickiextremes formula is great, perfect - that I'll i'm asking is if an indicator could be made for the $TICK ( newyorks advancing ticks vs. declining ticks ) in the same way you designed the $TICKI extemes formula.

              TICKI is Dow30 advancing /declining ticks
              TICK is entire NYSE advancing/declining ticks

              symbol for ticki is $TIKI (i think)
              symbol for tick is $TICK (I know for sure)

              there is a formula for the $TICK in the forum, but it is inferiour to you're formula for the Ticki.
              See what im asking?
              just replace the symbol $TICKI with $TICK and apply that to the formula you allready made (tickiextreme) - mabey call the new formula TICKextremes.

              I hope I explained myself better and Thanks very much for you're time. This is very important to me - if you need to ask me anything my phone # is 773-725-2732

              Thanks
              Graham

              Comment


              • #8
                Graham
                I think you can just edit the formula with the Editor and substitute the "$ticki" with "$tick" in Lines 43, 52 and 54.
                Then you may want to change the upper and lower thresholds currently set at +/-24 in Lines 35 and 36.
                Finishing touches would be to edit the name of the study and labels in Lines 14 through 17
                Save the efs with a different name.
                Alex

                Comment


                • #9
                  Re: Reply to post 'Ticki Extemes and the $tick'

                  Thanks Alex,
                  Graham
                  ----- Original Message -----
                  From: <[email protected]>
                  To: <[email protected]>
                  Sent: Friday, May 02, 2003 8:50 AM
                  Subject: Reply to post 'Ticki Extemes and the $tick'


                  > Hello GDAVIS01,
                  >
                  > ~~~~~~~~~~~~~~~~~~~~~~~~~~~~
                  >

                  Comment


                  • #10
                    I thought I'd test my programming skills ( basically non-existent ) and try to replace $TICKI with $TICK everywhere it occured. Seemed to work just fine ( Click on Tools, then Editor ).
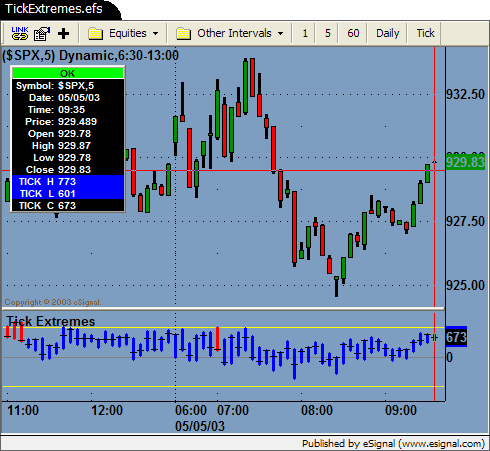
                    New efs is attached.

                    Thanks.
                    Attached Files

                    Comment


                    • #11
                      Scott, Alex, Jason
                      I replaced $ticki with $tick and changed the values for the extreme reading to +1000 -1000 (thanks alex) but now I have a histogram. I'm going to try to post a picture of what I have.
                      well I tryed to copy it to the clipboard and paste - but that didnt work.
                      I'll try to explain
                      The original Tickiextreme indicator's bars dont center aroung a straight 0 line - like in a histogram. Dont get me wrong - there is a line that goes thru the middle and it's value is 0 BUT the bars - each individual bar shows the extreme + and - reading - with a black mark for a closing level.

                      What I have is the bars start at the 0 level and move either + or negative from there Just like a histogram. It does show the ectreme reading on one end but not the other.
                      I'm getting very close and I appreciatew hte help
                      Graham

                      Comment


                      • #12
                        Graham
                        I see what you are saying. All the upper bars have a low that goes to 0 and the lower bars have a high at 0.
                        Interestingly enough the problem is reduced almost completely if using higher intervals such as 60 minutes.
                        Looks like Jason will have to be the one to intervene here.
                        Alex

                        Comment


                        • #13
                          Hello Everyone,

                          I've added a new formula to our library for the TickExtremes.efs. Just replacing $Ticki with $Tick was only part of the solution. $Ticki oscillates above and below a zero. $Tick does not exhibit the same behavior. In many instances, the high and low can both be above or below zero so we also need to adjust the histogram base on each bar with (H+L)/2 to get the desired result. See lines 64-66.

                          Jason K.
                          Project Manager
                          eSignal - an Interactive Data company

                          EFS KnowledgeBase
                          JavaScript for EFS Video Series
                          EFS Beginner Tutorial Series
                          EFS Glossary
                          Custom EFS Development Policy

                          New User Orientation

                          Comment


                          • #14
                            Hmm - I downloaded the file but the outcome looks different from your picture. The upper range of the histogram is always the same =1000 only if it runs above that it shows the value???
                            I am using so far a regular bar chart and was switching back and forth between the mini and the $ticks. Do we have to use a histogram, I would prefer a regular H/L/C bar chart. Could that be run as a study below the regular Emini chart?

                            Comment


                            • #15
                              I'm having different problem

                              I have to agree with Herman -
                              Jason,
                              I downloaded your'e modified version and what I have does not look like you're picture. By the way the picture you have is EXACTLY what I'm trying to get.
                              Mine looks like how Herman decribed it
                              Almost all the bars are flat across the top and have different bottoms. Nothing like you.
                              Thanks
                              Graham

                              Comment

                              Working...
                              X