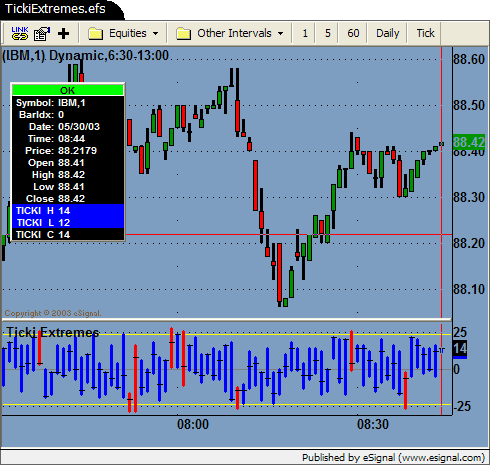
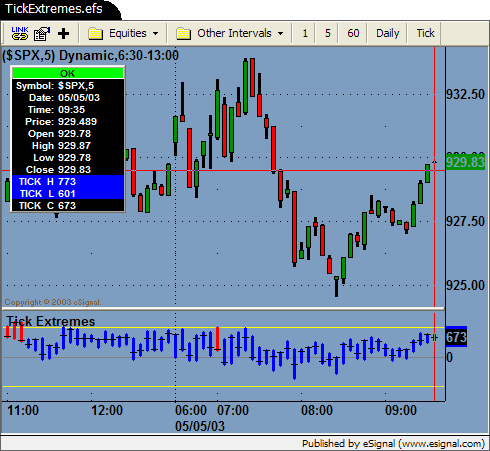
I downloaded the Ticki Extremes indicator and was wondering what is the source data. The Tiki is released from the NYSE every x amount of seconds during TRADING hours for the NYSE. SO how come I am getting tiki data all night in the after hours.
The other thing is that if the TICKI EXtremes indicator is getting it's data from the night sesion data then what data exactly.
The one thing I can say is I have been searching for a $tick indicator and downloaded one from this post - but it's in histogram format. That doesnt show the extremes of the reading for the time period selected.
What I need is a bar chart form of $tick - or the same format as the Tickiextremes - with the little black mark to show where it closed for that bar period.
If enyone can help That whould be greatly appreciated.
Graham


 ) and try to replace $TICKI with $TICK everywhere it occured. Seemed to work just fine ( Click on Tools, then Editor ).
Comment