Announcement

Collapse
No announcement yet.

Ticki Extemes and the $tick

Collapse
X
 
  • Filter
  • Time
  • Show
Clear All
new posts

  • #16
    One more thing

    I just wantee to add
    Herman says it best when he ask
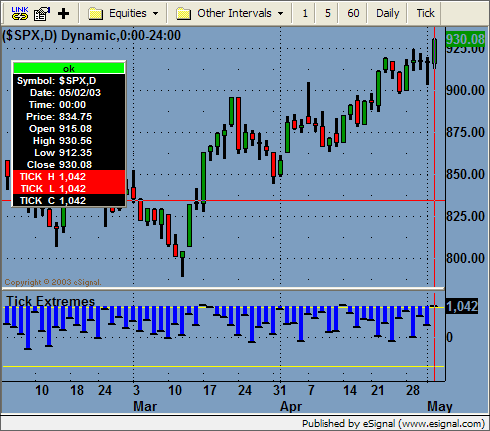
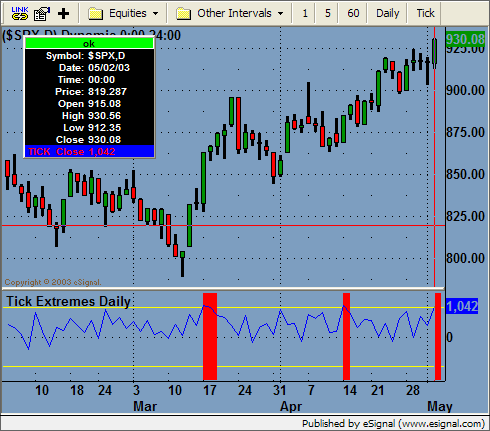
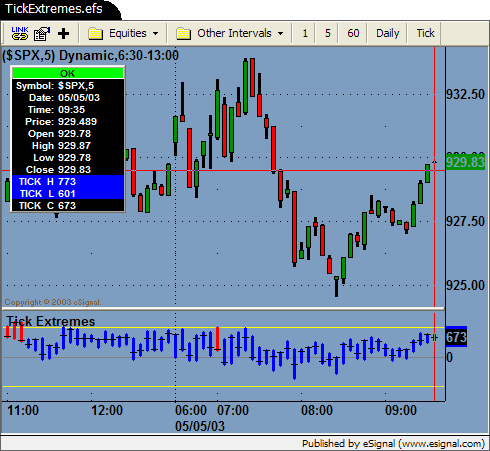
    do we have to use a histogram?
    need to be able to see trends in the ticks - histogram prevents this

    but isnt the picture of what Jason came up with very much what's needed ?

    Graham

    Comment


    • #17
      I failed to mention that the TickExtremes.efs is only useful with intra-day intervals because we don't have the historical Open High Low data for the $Tick on the daily interval. That's why you are seeing the weird histograms.


      The best we can do for the daily interval is plot the $Tick as a line and change the background of the indicator red when one of the extremes are breached. Try the attached formula.

      Attached Files
      Jason K.
      Project Manager
      eSignal - an Interactive Data company

      EFS KnowledgeBase
      JavaScript for EFS Video Series
      EFS Beginner Tutorial Series
      EFS Glossary
      Custom EFS Development Policy

      New User Orientation

      Comment


      • #18
        Only do intraday

        Jason,
        I am having the problem with intraday data - 5 minutes and so forth
        I dont even use daily charts except for a very broad outlook.

        I am getting that funny looking chart with and of the time periods I plot.
        I copied the formula twice anmd reinstalled
        Graham

        Comment


        • #19
          Hi Graham,

          Go to Help/About and tell me the version and build number you are using.
          Jason K.
          Project Manager
          eSignal - an Interactive Data company

          EFS KnowledgeBase
          JavaScript for EFS Video Series
          EFS Beginner Tutorial Series
          EFS Glossary
          Custom EFS Development Policy

          New User Orientation

          Comment


          • #20
            I was able to get mine to look like Jason's if I set my time template to normal trading hours. I first loaded it on a ES chart that was set at 24hrs, and it did as Graham described...atleast thats what it seems to me.

            cas

            Comment


            • #21
              Version

              Hi Jason
              version 7.3 Build 578 Beta

              Comment


              • #22
                I was happy using the tickiextremes formula edited for use with the $tick until GDAVIS01 pointed out that as a histogram it always started at the 0 line even if the values didn't hit that level.

                So I tried the new TickExtremes.efs but am seeing the same problem of flattopping of many bars.
                It happens for all candle timeframes and can be seen in Jason's pic near the 12 pm area.

                Perhaps this can shed some light on what needs to be corrected,
                Notice the TICK HLC values in this attached image and compare them to the previous candle. Something isn't quite right.
                This will be a welcome and valuable visual indication to the day's strength/weakness when finished.

                Thanks Jason and all,
                Brian

                P.S. I'd like to request a solid 0 line be added.
                Attached Files
                Last edited by brianb; 05-03-2003, 07:04 PM.

                Comment


                • #23
                  Hello Brian,

                  I found the problem. I was assuming that I could change the histogram base for each individual bar and use the histogram bars to simulate the high/low bar. However, setHistogramBase() will change the base for all bars in the chart, thus creating sections of flat bottoms or tops with $TICK. The new formula solves this problem by drawing lines with drawLineRelative() function. The only problem is we have to limit the total number of lines drawn with this function as too many lines will slow down the performance of the chart. 150 or less seems to work fine on my end. I set up the formula so you can change that number through the "Edit Studies" option. If you scroll back past the 150 bars you will still see the high and low drawn as dots with the black line for the close.

                  TickExtremes.efs

                  Jason K.
                  Project Manager
                  eSignal - an Interactive Data company

                  EFS KnowledgeBase
                  JavaScript for EFS Video Series
                  EFS Beginner Tutorial Series
                  EFS Glossary
                  Custom EFS Development Policy

                  New User Orientation

                  Comment


                  • #24
                    Thanks Jason it works great ! Limiting the lines drawn seems to let it load quicker too with no loss of usefulness.

                    Comment


                    • #25
                      Ticks are great !!

                      Jason,
                      I just wanted to say - first off - thanks
                      This is what I was looking for -
                      I'm very pleased with how the indicator works now

                      second,
                      could you take a quick look at the TICKI extremes code?
                      I really didnt notice before but if you look at the ranges in the $TICKI - sometimes the bars hi and lo points do NOT follow Whats posted for the HI and Low in the cursor window. There must be some kind of an error in the code.
                      I was also getting alot of flat topping the other day.
                      Mabey whatever changes you made to the $TICK is applicable to the $TICKI.
                      appreciate the help lots,
                      Graham

                      Comment


                      • #26
                        Hello Graham,

                        I've updated the TickiExtremes.efs formula to incorporate the same changes made to the TickExtremes.
                        Jason K.
                        Project Manager
                        eSignal - an Interactive Data company

                        EFS KnowledgeBase
                        JavaScript for EFS Video Series
                        EFS Beginner Tutorial Series
                        EFS Glossary
                        Custom EFS Development Policy

                        New User Orientation

                        Comment


                        • #27
                          I am wondering if anyone has updated the TickiExtreme.efs for EFS2. In particular for alternate chart time frames?

                          Thanks very much. Joe.

                          Comment


                          • #28
                            Hello Everyone,

                            I want to compute a Tick over an index, meaning a calculation of for example in the case of the DAX the up´s and down´s of 30 different Stocks ending up at a Tick like the one from the NY exchange. Is that possible with EFS?

                            Thanks for the help!

                            Comment


                            • #29
                              FDAX_Trader
                              It is not possible because an efs can access up to a maximum of 7 symbols.
                              Alex

                              Comment

                              Working...
                              X