Announcement

Collapse
No announcement yet.

Floor/Ceiling - Min/Max Of custom function for 100 bars back

Collapse
X
 
  • Filter
  • Time
  • Show
Clear All
new posts

  • Floor/Ceiling - Min/Max Of custom function for 100 bars back

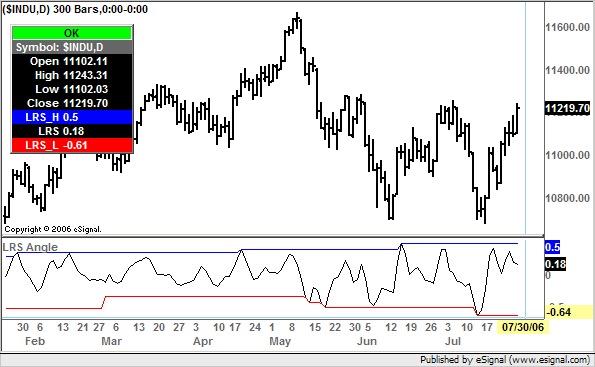
    I have used Alexis's Linear Regression study and only slightly modified it. This takes the log of hlc3(inv("D")) for the past 3 bars and returns a linear regression. I need both the result for this daily on the chart I am using and also the min & max values for the result of this code for the past 100 bars. Any suggestions an an efficient way to do this. (Sidenote: Apologize, have not used Javascript since 00 and and very new with eSignal)

    Best Regards and Thanks,

    Tim

    PHP Code:
    function preMain(){
        
    setPriceStudy(false);
        
    setCursorLabelName("LRS"0);
    }
    function 
    main(length,source){ 
        if(
    length==nulllength 4;
        if(
    source==nullsource hlc3(inv("D"));
        else 
    source = eval(hlc3(inv("D")));//see Notes
        
    if(getCurrentBarCount()<length) return;
        var 
    Sum1 0;
        var 
    Sum2 0;
        var 
    SumBars length*(length-1)*.5;   
        var 
    SumSqBars = (length-1)*length*(2*length-1)/6;
       
        for(var 
    i=0i<lengthi++) {
            
    test Math.log(source.getValue(-i))
            
    Sum1 Sum1+i*test;
            
    Sum2 += test;
        }
    var 
    Sum3 SumBars*Sum2;
    var 
    Num length*Sum1-Sum3;   
    var 
    Den SumBars*SumBars-length*SumSqBars;    
    if (
    Den != 0) {
            var 
    LRS Num/Den;
            
    LRS     LRS
            
            LRS      
    =  Math.atan(LRS)/( Math.PI/180 ); 
     }
     return (
    LRS);


  • #2
    This should get you closer...

    Haven't figured out the 100 bars part yet.

    PHP Code:

    function preMain(){
        
    setPriceStudy(false);
        
    setCursorLabelName("LRS"0);

        
    setCursorLabelName("MaxLRS"1);
        
    setCursorLabelName("MinLRS"2);


    setDefaultBarFgColor(Color.green,0);
        
    setDefaultBarFgColor(Color.red,1);
        
    setDefaultBarFgColor(Color.blue,2);
    }


        var 
    MaxLRS null;
        var 
    MinLRS null;

    function 
    main(length,source){ 
        if(
    length==nulllength 4;
        if(
    source==nullsource hlc3(inv("D"));
        else 
    source = eval(hlc3(inv("D")));//see Notes
        
    if(getCurrentBarCount()<length) return;
        var 
    Sum1 0;
        var 
    Sum2 0;
        var 
    SumBars length*(length-1)*.5;   
        var 
    SumSqBars = (length-1)*length*(2*length-1)/6;
       
        if(
    MaxLRS == nullMaxLRS 0;
        if(
    MinLRS == nullMinLRS 999999999;


        for(var 
    i=0i<lengthi++) {
            
    test Math.log(source.getValue(-i))
            
    Sum1 Sum1+i*test;
            
    Sum2 += test;
        }
    var 
    Sum3 SumBars*Sum2;
    var 
    Num length*Sum1-Sum3;   
    var 
    Den SumBars*SumBars-length*SumSqBars;    
    if (
    Den != 0) {
            var 
    LRS Num/Den;
            
    LRS     LRS
            
            LRS      
    =  Math.atan(LRS)/( Math.PI/180 ); 


     }


    if(
    LRS MaxLRS) { MaxLRS LRS} ;

    if(
    LRS MinLRS) { MinLRS LRS} ;


     return new Array(
    LRSMaxLRSMinLRS );

    Attached Files

    Comment


    • #3
      I AM STUMPED


      I read the knowledgebase but can't seem to get this to work!


      MaxLRS = highest( iNumBars, LRS ) ;
      MinLRS = lowest( iNumBars, LRS ) ;

      Shouldn't that create a series?

      iNumbars IS defined and set = 100.

      So why does this hang?

      The first version runs fine.

      THIS IS SO FRUSTRATING!

      I can't wait until I know this stuff.

      All the little "gotcha's"

      GRRRRRRRRRRRRRRRRRRRR!!!!!!!!!!!!!!!!!!!!!!


      PHP Code:
      function preMain(){
          
      setPriceStudy(false);
          
      setCursorLabelName("LRS"0);

          
      setCursorLabelName("MaxLRS"1);
          
      setCursorLabelName("MinLRS"2);


      setDefaultBarFgColor(Color.green,0);
          
      setDefaultBarFgColor(Color.red,1);
          
      setDefaultBarFgColor(Color.blue,2);
      }

          var 
      MaxLRS null;
          var 
      MinLRS null;

      function 
      mainiNumBars length,  source){ 

       
          var 
      xInterval getInterval()    ;


          if(
      iNumBars==nulliNumBars 100;
          if(
      length==nulllength 4;
          if(
      source==nullsource hlc3(inv("D"));
          else 
      source = eval(hlc3(inv("D")));//see Notes
          
      if(getCurrentBarCount()<length) return;
          var 
      Sum1 0;
          var 
      Sum2 0;
          var 
      SumBars length*(length-1)*.5;   
          var 
      SumSqBars = (length-1)*length*(2*length-1)/6;
         
          if(
      MaxLRS == nullMaxLRS 0;
          if(
      MinLRS == nullMinLRS 999999999;


          for(var 
      i=0i<lengthi++) {
              
      test Math.log(source.getValue(-i))
              
      Sum1 Sum1+i*test;
              
      Sum2 += test;
          }
      var 
      Sum3 SumBars*Sum2;
      var 
      Num length*Sum1-Sum3;   
      var 
      Den SumBars*SumBars-length*SumSqBars;    
      if (
      Den != 0) {
              var 
      LRS Num/Den;
              
      LRS     LRS
              
              LRS      
      =  Math.atan(LRS)/( Math.PI/180 ); 

       }


      MaxLRS highestiNumBarsLRS ) ;  
      MinLRS lowestiNumBarsLRS ) ;


       if ( 
      isLastBarOnChart() == true ) { 

      debugPrint"MaxLRS: " formatPriceNumberMaxLRS ) + "\n" ); 
       
      debugPrint"MinLRS: " formatPriceNumberMinLRS ) + "\n" ); 

      debugPrint"iNumBars: " formatPriceNumberiNumBars ) + "\n" ); 
      }

       return new Array(
      LRSMaxLRSMinLRS );

      Comment


      • #4
        I THINK I FIGURED IT OUT

        var vaLRV = ( LRS , inv(xInterval) ) ;

        MaxLRS = highest( iNumBars, vaLRV ) ;
        MinLRS = lowest( iNumBars, vaLRV ) ;

        Seems to have done it!


        PHP Code:
        function preMain(){
            
        setPriceStudy(false);
            
        setCursorLabelName("LRS"0);

            
        setCursorLabelName("MaxLRS"1);
            
        setCursorLabelName("MinLRS"2);


        setDefaultBarFgColor(Color.green,0);
            
        setDefaultBarFgColor(Color.red,1);
            
        setDefaultBarFgColor(Color.blue,2);
        }

            var 
        MaxLRS null;
            var 
        MinLRS null;

        function 
        mainiNumBars length,  source){ 

         
            var 
        xInterval getInterval()    ;


            if(
        iNumBars==nulliNumBars 100;
            if(
        length==nulllength 4;
            if(
        source==nullsource hlc3(inv("D"));
            else 
        source = eval(hlc3(inv("D")));//see Notes
            
        if(getCurrentBarCount()<length) return;
            var 
        Sum1 0;
            var 
        Sum2 0;
            var 
        SumBars length*(length-1)*.5;   
            var 
        SumSqBars = (length-1)*length*(2*length-1)/6;
           
            if(
        MaxLRS == nullMaxLRS 0;
            if(
        MinLRS == nullMinLRS 999999999;


            for(var 
        i=0i<lengthi++) {
                
        test Math.log(source.getValue(-i))
                
        Sum1 Sum1+i*test;
                
        Sum2 += test;
            }
        var 
        Sum3 SumBars*Sum2;
        var 
        Num length*Sum1-Sum3;   
        var 
        Den SumBars*SumBars-length*SumSqBars;    
        if (
        Den != 0) {
                var 
        LRS Num/Den;
                
        LRS     LRS
                
                LRS      
        =  Math.atan(LRS)/( Math.PI/180 ); 

         }

        var 
        vaLRV = ( LRS inv(xInterval) ) ;

        MaxLRS highestiNumBarsvaLRV ) ;  
        MinLRS lowestiNumBarsvaLRV ) ;


         if ( 
        isLastBarOnChart() == true ) { 

        debugPrint"MaxLRS: " formatPriceNumberMaxLRS ) + "\n" ); 
         
        debugPrint"MinLRS: " formatPriceNumberMinLRS ) + "\n" ); 

        debugPrint"iNumBars: " formatPriceNumberiNumBars ) + "\n" ); 
        }

         return new Array(
        LRSMaxLRSMinLRS );

        Attached Files

        Comment


        • #5
          Many thanks for all of your hard work so far.

          What I was hoping for and still has me stumped is this: I need the Maximum and Minimum values of the LRS(angle) that is being calculated for the past 100 bars, not of the price.

          Any help that you could provide would be greatly appreciated.

          Best Regards,

          Tim

          Comment


          • #6
            What variable is the angle?

            Comment


            • #7
              The LRS variable ends up being the angle

              PHP Code:
              LRS      =  Math.atan(LRS)/( Math.PI/180 ); 
              But The Min and the Max return to me price figures

              iNumBars: 100
              MinLRS: 1223.69
              MaxLRS: 1325.76
              LRS: .2

              .2 (LRS) value is the angle, this angle value is what I need the min and max of for the past 100 bars and is calculated off of hlc3 for 3 bars to return the Linear Regression. That 3 day linear regression is what I need the Max & Min of for a rolling 100 bars back

              Again Many Thanks,

              Tim

              Comment


              • #8
                buzzhorton:

                Your First reply was the closest, just need to know how to do the rolling 100 bars in there

                best,

                Tim

                Comment


                • #9
                  This is really frustrating... I can't seem to figure it out.

                  I know it is something simple!

                  But for some reason, I can't get the EFS to work properly...


                  Originally posted by arbor03
                  The LRS variable ends up being the angle

                  PHP Code:
                  LRS      =  Math.atan(LRS)/( Math.PI/180 ); 
                  But The Min and the Max return to me price figures

                  iNumBars: 100
                  MinLRS: 1223.69
                  MaxLRS: 1325.76
                  LRS: .2

                  .2 (LRS) value is the angle, this angle value is what I need the min and max of for the past 100 bars and is calculated off of hlc3 for 3 bars to return the Linear Regression. That 3 day linear regression is what I need the Max & Min of for a rolling 100 bars back

                  Again Many Thanks,

                  Tim

                  Comment


                  • #10
                    I still can't figure out SERIES.

                    I know that LRS needs to be a series!!

                    But, here's another way around ....

                    The study starts processing when getCurrentBarIndex() > -100 .

                    That means the last value plotted for MinLRS and MaxLRS should be of use to you.

                    I hope someone figures this out and posts it so we all can learn and benefit.


                    PHP Code:
                    var xInit   false;

                    var 
                    xOpen   null;
                    var 
                    xHigh   null;
                    var 
                    xLow    null;
                    var 
                    xClose  null;

                    var 
                    MaxLRS null;
                    var 
                    MinLRS null;


                    function 
                    preMain(){    setCursorLabelName("LRS"0);

                        
                    setCursorLabelName("MaxLRS"1);
                        
                    setCursorLabelName("MinLRS"2);


                    setDefaultBarFgColor(Color.green,0);
                        
                    setDefaultBarFgColor(Color.red,1);
                        
                    setDefaultBarFgColor(Color.blue,2);

                    }
                    function 
                    main(length,source){ 

                        if(
                    MaxLRS == nullMaxLRS 0;
                        if(
                    MinLRS == nullMinLRS 999999999;

                        if(
                    xInit==false){         


                    xOpen   =  openinv("D") ) ;


                    xHigh   =  highinv("D") ) ;

                             
                    xLow    =  lowinv("D") ) ;

                             
                    xClose  =  closeinv("D") ) ;

                             
                    xInit=true;

                        } 
                    // xInit 


                    var zOpen   xOpen.getValue(0) ;

                    var 
                    zClose1 xClose.getValue(-1) ;

                    var 
                    zHigh   xHigh.getValue(-1) ;

                    var 
                    zLow    xLow.getValue(-1) ;

                    var 
                    zMid1   rnd( ((zHigh zLow) * .50) , )   ;
                    var 
                    zGap    rnd( (zOpen zClose1) , 2) ;

                        if(
                    length==nulllength 4;
                        if(
                    source==nullsource hlc3(inv("D"));
                        else 
                    source = eval(hlc3(inv("D")));//see Notes
                        
                    if(getCurrentBarCount()<length) return;
                        var 
                    Sum1 0;
                        var 
                    Sum2 0;
                        var 
                    SumBars length*(length-1)*.5;   
                        var 
                    SumSqBars = (length-1)*length*(2*length-1)/6;
                       
                        for(var 
                    i=0i<lengthi++) {
                            
                    test Math.log(source.getValue(-i))
                            
                    Sum1 Sum1+i*test;
                            
                    Sum2 += test;
                        }
                    var 
                    Sum3 SumBars*Sum2;
                    var 
                    Num length*Sum1-Sum3;   
                    var 
                    Den SumBars*SumBars-length*SumSqBars;    
                    if (
                    Den != 0) {
                            var 
                    LRS Num/Den;
                            
                    LRS     LRS
                            
                            LRS      
                    =  Math.atan(LRS)/( Math.PI/180 ); 
                     }

                     
                    if( 
                    getCurrentBarIndex() > -100 ) {


                    if(
                    LRS MaxLRS) { MaxLRS LRS} ;

                    if(
                    LRS MinLRS) { MinLRS LRS} ;


                    // getCurrentBarIndex


                    debugPrint"MinLRS                 : " MinLRS  "\n" 
                    debugPrint"MaxLRS                 : " MaxLRS  "\n" ); 
                    debugPrint"getOldestBarIndex()    : " getOldestBarIndex()   + "\n" ); 
                    debugPrint"getCurrentBarIndex()   : " getCurrentBarIndex()  + "\n" ); 
                    debugPrint"getCurrentBarCount()   : " getCurrentBarCount()  + "\n" ); 


                    debugPrint"--------------- " +  "\n" ); 

                    return new Array(
                    LRSMaxLRSMinLRS );

                    }

                    //==rnd will round to N digits.
                    function rnd(valueN) {
                        var 
                    n;
                        var 
                    mult=1;
                        for(
                    n=0;n<N;n++) mult*=10;
                        
                    value*=mult;
                        return 
                    Math.roundvalue,N)/mult;

                    Attached Files

                    Comment


                    • #11
                      I found this...


                      I copied and modified the code to see if I code get it to work...

                      Dang, it seems I am so close..

                      PHP Code:

                      function preMain() {
                          
                      setPriceStudy(false);
                          
                      setStudyTitle("IE2");


                      setCursorLabelName("LRS"0);

                          
                      setCursorLabelName("MaxLRS"1);
                          
                      setCursorLabelName("MinLRS"2);


                      setDefaultBarFgColor(Color.green,0);
                          
                      setDefaultBarFgColor(Color.red,1);
                          
                      setDefaultBarFgColor(Color.blue,2);
                      }
                       
                      //declare global variables
                      var bInit false;
                      var 
                      xMA null;
                      var 
                      xLRS null;
                      var 
                      xLR null;

                      var 
                      length null;

                      var 
                      Sourcenull;


                      var 
                      MaxLRS null;
                      var 
                      MinLRS null;


                      //end declaring global variables
                       
                      function main(length,Source){
                       
                          
                      //intialize the parameters and studies


                      if(MaxLRS == nullMaxLRS 0;
                          if(
                      MinLRS == nullMinLRS 999999999;

                          if(
                      length==nulllength 4;
                          if(
                      Source==nullSource hlc3(inv("D"));
                          else 
                      Source = eval(hlc3(inv("D")));//see Notes
                          
                          
                      if(bInit==false){
                              
                      xMA sma(lengthSource);
                              
                      xLR efsExternal("LR.efs",length,Source);//call the efs and pass the parameters
                              
                      xLRS efsExternal("LRS.efs",length,Source);//call the efs and pass the parameters
                              
                      bInit=true;
                          }
                          
                      //end intializing parameters and studies
                          
                          //declare the local variables and assign the values
                          
                      var nMA xMA.getValue(0);
                          var 
                      nLRS xLRS.getValue(0);
                          var 
                      nLR xLR.getValue(0);
                          
                      //end declaring local variables
                          
                          
                      if(nMA==null || nLRS==null || nLR==null) return;//null check
                          
                          
                      var IE2 = ((nLRS+nMA)+nLR)/2;//calculate the IE/2 average


                      MaxLRS highest100nLRS ) ;  
                      MinLRS lowest100nLRS ) ;

                       return new Array(
                      nLRSMaxLRSMinLRS );
                      }
                       
                      //Notes:
                      //When inputting a Source in Edit Studies use high(), hl2(), etc.
                      //Because these will be strings ie "high()", "hl2()" etc we use the eval() function 
                      //in line 19 to evaluate that string in other words to read it as if it were written
                      //without the quotes "". For more information on the eval() function see the article
                      //in the Core JavaScript Guide in the EFS KnowledgeBase (link provided below) 

                      Comment


                      • #12
                        Tim
                        The enclosed efs should do what you want. It computes the highest and lowest values of the LRS angle over the user defined period.
                        All inputs are user definable through Edit Studies and the efs is enabled to use external symbols and/or intervals (which means that you can for example run this on a 15 minute chart of ES while calculating the daily value of the LRS angle of NQ).
                        Alex

                        Attached Files

                        Comment


                        • #13
                          Ok Alexis:

                          Can you explain how and why this works?

                          Specifically:

                          1) You turned the LRS calc into an internal function.. what is the reason?

                          2) You used:
                          xLRSH = upperDonchian(Lookback,xLRS);
                          xLRSL = lowerDonchian(Lookback,xLRS);

                          to get the highest high/ lowest low... what is the reason?

                          3) You used:


                          return new Array(getSeries(xLRSH),getSeries(xLRS),getSeries(x LRSL));

                          What is the reason?

                          Nothing is obvious to me.

                          This series stuff still hasn't clicked for me.

                          THANKING YOU IN ADVANCE.


                          Originally posted by Alexis C. Montenegro
                          Tim
                          The enclosed efs should do what you want. It computes the highest and lowest values of the LRS angle over the user defined period.
                          All inputs are user definable through Edit Studies and the efs is enabled to use external symbols and/or intervals (which means that you can for example run this on a 15 minute chart of Es while calculating the daily value of the LRS angle of NQ).
                          Alex

                          Comment


                          • #14
                            Alexis, I hope you can tell that I am NOT lazy.

                            I don't mind looking stuff up and figuring it out.

                            But SOMETIMES, things just don't make sense to me.

                            Part of the problem comes from knowing other systems.

                            Now, I found this getseries example:

                            PHP Code:
                            var myStudy1 null
                            var 
                            myStudy2 null
                            var 
                            bInit false

                            function 
                            main() { 

                               if ( 
                            bInit == false ) { 
                                   
                                  
                            //create a 20-period EMA using 30-min bars 
                                  
                            myStudy1 ema20inv(30) ); 

                                  
                            //create a 20-period EMA using 60-min bars 
                                  
                            myStudy2 ema20inv(60) ); 

                                  
                            bInit true

                               } 

                               
                            //use getSeries() to assure that the actual series is being returned, rather than the values 
                               
                            return new Array( getSeriesmyStudy1 ), getSeriesmyStudy2 ) ); 
                               
                               } 

                            But that just doesn't seem intuitive.

                            It says "actual series"... doesn't that mean more than one value at a time or does it mean the most recent value of the series?

                            So I made a little modification:


                            PHP Code:

                            var myStudy1 null
                            var 
                            myStudy2 null
                            var 
                            bInit false

                            function 
                            main() { 

                               if ( 
                            bInit == false ) { 
                                   
                                  
                            //create a 20-period EMA using 30-min bars 
                                  
                            myStudy1 ema20inv(30) ); 

                                  
                            //create a 20-period EMA using 60-min bars 
                                  
                            myStudy2 ema20inv(60) ); 

                                  
                            bInit true

                               } 
                               
                               
                            zmyStudy1  myStudy1.getValue(0) ;
                               
                            zmyStudy2  myStudy2.getValue(0) ;

                              
                                return new Array( 
                            zmyStudy1 zmyStudy2);   
                               } 
                            This is OBVIOUS. zmyStudy1 contains the most recent occurence of myStudy1. And returning:

                            return new Array( zmyStudy1 , zmyStudy2);

                            is obvious.

                            But to me,

                            return new Array( getSeries( myStudy1 ), getSeries( myStudy2 ) );

                            is NOT obvious.

                            One day, this series stuff will sink in... sooner than later, I hope!

                            Comment


                            • #15
                              Alexis,

                              Many thanks!

                              Can't thank you enough for your hard work.

                              This is exactly what I was looking for.

                              Best Regards,

                              Tim

                              Comment

                              Working...
                              X