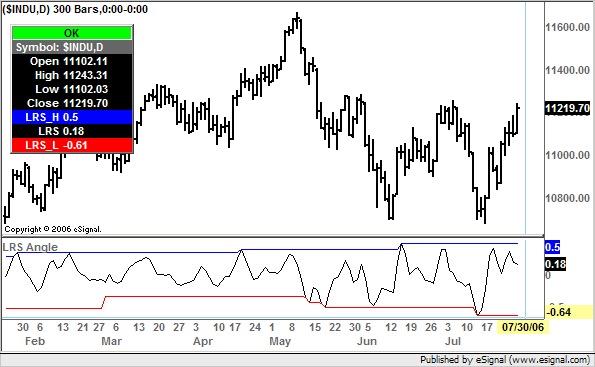
I have used Alexis's Linear Regression study and only slightly modified it. This takes the log of hlc3(inv("D")) for the past 3 bars and returns a linear regression. I need both the result for this daily on the chart I am using and also the min & max values for the result of this code for the past 100 bars. Any suggestions an an efficient way to do this. (Sidenote: Apologize, have not used Javascript since 00 and and very new with eSignal)
Best Regards and Thanks,
Tim
Best Regards and Thanks,
Tim
PHP Code:
function preMain(){

    setPriceStudy(false);

    setCursorLabelName("LRS", 0);

}

function main(length,source){

    if(length==null) length = 4;

    if(source==null) source = hlc3(inv("D"));

    else source = eval(hlc3(inv("D")));//see Notes

    if(getCurrentBarCount()<length) return;

    var Sum1 = 0;

    var Sum2 = 0;

    var SumBars = length*(length-1)*.5;

    var SumSqBars = (length-1)*length*(2*length-1)/6;


    for(var i=0; i<length; i++) {

        test = Math.log(source.getValue(-i))

        Sum1 = Sum1+i*test;

        Sum2 += test;

    }

var Sum3 = SumBars*Sum2;

var Num = length*Sum1-Sum3;

var Den = SumBars*SumBars-length*SumSqBars;

if (Den != 0) {

        var LRS = Num/Den;

        LRS     = LRS


        LRS      =  Math.atan(LRS)/( Math.PI/180 );

 }

 return (LRS);

}


Comment