Announcement

Collapse
No announcement yet.

Settlement v Actual Close problem........again.

Collapse
X
 
  • Filter
  • Time
  • Show
Clear All
new posts

  • Settlement v Actual Close problem........again.

    I know this subject doesn't interest too many traders in the Land of The Free, but we antipodeans pay the same for eSignal as everyone else (possibly more) and could really use some sympathetic help.

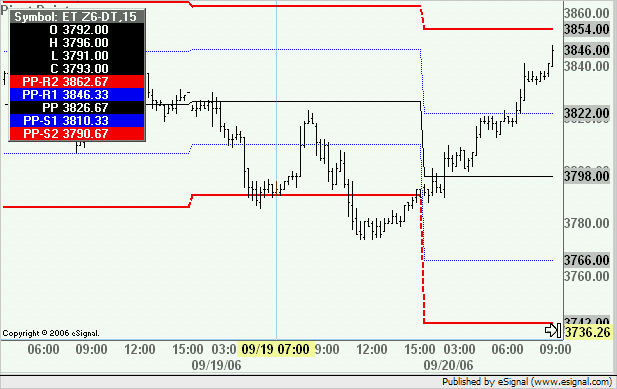
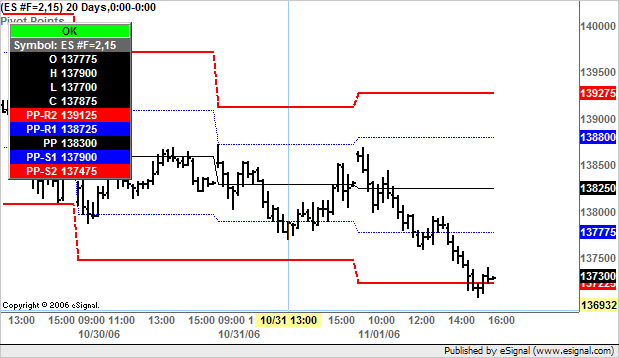
    The Eurex Daily Settlement still gives a pivot calc problem because settlement is calculated at the underlying close of 17:30 local instead of at 22:00 when the futures market closes. (Please see attached chart of recent open of the DJ EuroSTOXX50).
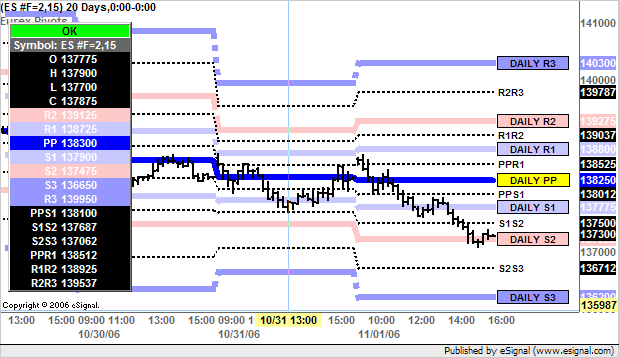
    Derivate Check (see below) have the correct pivots because they are calculated from the ACTUAL close. Question is, how can I get EFS to make it's calc from the 22:00 close and not the 17:30 close?

    Huge thanks in anticipation.


  • #2
    ozfader
    I believe that in this thread Jason has already provided you with a solution which is to determine the change in date using if(day(0)!=day(-1) and at that time retrieve the value of the Close at the prior bar which you then use to calculate the pivots.
    Enclosed below is a revision of PivotPointAll.efs (which is included in the Pivots folder) that implements the simple change suggested by Jason (the modification is commented in the script)
    All you need to do is to set the Time Template of the chart to the trading hours of the symbol which will exclude the Settlement tick
    PHP Code:
    /******************************************************************************************
    Copyright © eSignal, a division of Interactive Data Corporation. 2005. All rights reserved.
    This sample eSignal Formula Script (EFS) may be modified and saved under a new filename;   
    however, eSignal is no longer responsible for the functionality once modified.             
    eSignal reserves the right to modify and overwrite this EFS file with each new release.    
    @version 3.0 by Alexis Montenegro for eSignal                                              
    *******************************************************************************************/
     
    function preMain() {
     
    setPriceStudy(true);
     
    setStudyTitle("Pivot Points");
     
    setCursorLabelName("PP-R2"0);
     
    setCursorLabelName("PP-R1"1);
     
    setCursorLabelName("PP"2);
     
    setCursorLabelName("PP-S1"3);
     
    setCursorLabelName("PP-S2"4);
     
    // R2
     
    setDefaultBarStyle(PS_DASH0);
     
    setDefaultBarFgColor(Color.RGB(255,0,0), 0);
     
    setDefaultBarThickness(20);
     
    // R1
     
    setDefaultBarStyle(PS_DOT1);
     
    setDefaultBarFgColor(Color.RGB(0,0,255), 1);
     
    setDefaultBarThickness(11);   
        
    // Pivot  Point
     
    setDefaultBarStyle(PS_SOLID2);
     
    setDefaultBarFgColor(Color.RGB(0,0,0), 2);
     
    setDefaultBarThickness(12);
        
    // S1
     
    setDefaultBarStyle(PS_DOT3);
     
    setDefaultBarFgColor(Color.RGB(0,0,255), 3);
     
    setDefaultBarThickness(13);
     
    // S2
     
    setDefaultBarStyle(PS_DASH4);
     
    setDefaultBarFgColor(Color.RGB(255,0,0), 4);
     
    setDefaultBarThickness(24);
    }
     
    var 
    bInit false;
    var 
    xHigh  null;
    var 
    xLow   null;
    //var xClose = null;//removed by ACM
    var vPP null;
    var 
    vR1 null;
    var 
    vS1 null;
    var 
    vR2 null;
    var 
    vS2 null;  
    var 
    vClose;//ACM added
     
    function main() {
     
        if(
    isMonthly() || isWeekly())
        return;
        
        if(
    bInit == false){
            
    xHigh  high(inv("D"));
            
    xLow   low(inv("D"));
            
    //xClose = close(inv("D"));//ACM removed (no longer required)
            
    bInit true;
        }
        
        var 
    vHigh  xHigh.getValue(-1);
        var 
    vLow   xLow.getValue(-1);
        
    //var vClose = xClose.getValue(-1);//ACM replaced with line below
        
    if(day(0)!=day(-1)) vClose close(-1);//ACM added
        
    if(vHigh == null || vLow == null || vClose == null)
        return;
        
        
    vPP = (vHigh+vLow+vClose)/3;
        
    vR1 2*vPP-vLow;
        
    vS1 2*vPP-vHigh;
        
    vR2 = (vPP-vS1)+vR1;
        
    vS2 vPP-(vR1-vS1);  
        
        return new Array(
    vR2vR1vPPvS1vS2);

    In the following chart you can see that the pivots are calculated using the intraday Close and not the Settlement. On 9/19 the value of PP is 3826.67 (which if rounded would display 3827) and not 3825.33
    Alex

    Comment


    • #3
      Many thanks Alexis,

      As a programmer I make a great photographer, however in the interim I've managed to utilize your pivotpointsall2.efs study (with a few slight personal pref changes) so that it's able to calculate the correct pivots for Eurex.

      I'm not knowledgeable enough to fully understand why it works, but it does, and for that I'm grateful. Thank you once again.

      I'm also not familiar with the protocol for altering and distibuting existing formulae, such as yours below. Perhaps you could comment?
      Last edited by ozfader; 09-25-2006, 03:18 PM.

      Comment


      • #4
        Alan
        You are most welcome.

        I'm also not familiar with the protocol for altering and distibuting existing formulae, such as yours below. Perhaps you could comment?
        If the author of the script allows it (and most will with open source code) you can freely modify and redistribute the formulae. In this case the common courtesy is to include the credits of the author and comments on all the changes made just as you did in the script you posted. Also if you post a modified script as a file attachment you may want to rename it so as not to create files with the same name.
        You may also want to consider storing your scripts in a group in File Sharing to which you can then provide links.
        Alex

        Comment


        • #5
          Originally posted by Alexis C. Montenegro

          You may also want to consider storing your scripts in a group in File Sharing to which you can then provide links.
          Will do so Alexis. Thanks again.

          PHP Code:
          /*********************************************************        
          Alexis C. Montenegro © December 2004                              
          Use and/or modify this code freely. If you redistribute it        
          please include this and/or any other comment blocks and a         
          description of any changes you make.                              

          //September 2006                                                  
          Added R3 and S3, plus midpoints and labels.                       
          Please note that EUREX traders need to correct for Daily          
          Settlement adjustments, etc. by setting their Time Template       
          to an Interval of 840, and similarly including an Optional        
          Close Interval of 840 in "Study Properties" under "Edit Studies". 
          Alan Vertue                                                       
          ******************************************************************/

          var fpArray = new Array();

          function 
          preMain() {

              
          setPriceStudy(true);
              
          setStudyTitle("Eurex Pivots");
              
          setCursorLabelName("R2",    0);
              
          setCursorLabelName("R1",    1);
              
          setCursorLabelName("PP",    2);
              
          setCursorLabelName("S1",    3);
              
          setCursorLabelName("S2",    4);
              
          setCursorLabelName("S3",    5);
              
          setCursorLabelName("R3",    6);
              
          setCursorLabelName("PPS1",  7);
              
          setCursorLabelName("S1S2",  8);
              
          setCursorLabelName("S2S3",  9);
              
          setCursorLabelName("PPR1"10);
              
          setCursorLabelName("R1R2"11);
              
          setCursorLabelName("R2R3"12);
              
              
          // Changes to Pivot lines
              //R3
              
          setDefaultBarStyle(PS_DOT6);
              
          setDefaultBarFgColor(Color.RGB(150,150,255), 6);
              
          setDefaultBarThickness(66);
              
          // R2
              
          setDefaultBarStyle(PS_DASH0);
              
          setDefaultBarFgColor(Color.RGB(255,200,200), 0);
              
          setDefaultBarThickness(60);
              
          // R1
              
          setDefaultBarStyle(PS_DOT1);
              
          setDefaultBarFgColor(Color.RGB(200,200,255), 1);
              
          setDefaultBarThickness(61);   
              
          // Pivot  Point
              
          setDefaultBarStyle(PS_SOLID2);
              
          setDefaultBarFgColor(Color.RGB(255,255,0), 2);
              
          setDefaultBarThickness(62);
              
          // S1
              
          setDefaultBarStyle(PS_DOT3);
              
          setDefaultBarFgColor(Color.RGB(200,200,255), 3);
              
          setDefaultBarThickness(63);
              
          // S2
              
          setDefaultBarStyle(PS_DASH4);
              
          setDefaultBarFgColor(Color.RGB(255,200,200), 4);
              
          setDefaultBarThickness(64);
              
          askForInput();
              
          // S3
              
          setDefaultBarStyle(PS_DOT5);
              
          setDefaultBarFgColor(Color.RGB(150,150,255), 5);
              
          setDefaultBarThickness(65);
              
          // PPS1
              
          setDefaultBarStyle(PS_DOT7);
              
          setDefaultBarFgColor(Color.RGB(0,0,0), 7);
              
          setDefaultBarThickness(27);
              
          // S1S2
              
          setDefaultBarStyle(PS_DOT8);
              
          setDefaultBarFgColor(Color.RGB(0,0,0), 8);
              
          setDefaultBarThickness(28);
              
          // S2S3
              
          setDefaultBarStyle(PS_DOT9);
              
          setDefaultBarFgColor(Color.RGB(0,0,0), 9);
              
          setDefaultBarThickness(29);
              
          // PPR1
              
          setDefaultBarStyle(PS_DOT10);
              
          setDefaultBarFgColor(Color.RGB(0,0,0), 10);
              
          setDefaultBarThickness(210);
              
          // R1R2
              
          setDefaultBarStyle(PS_DOT11);
              
          setDefaultBarFgColor(Color.RGB(0,0,0), 11);
              
          setDefaultBarThickness(211);
              
          // R2R3
              
          setDefaultBarStyle(PS_DOT12);
              
          setDefaultBarFgColor(Color.RGB(0,0,0), 12);
              
          setDefaultBarThickness(212);
          }


          askForInput();
              
              var 
          x=0;
              
          fpArray[x] = new FunctionParameter("Symbol"FunctionParameter.STRING);
              
          with(fpArray[x++]){
                  
          setDefault();
              }
              
          fpArray[x] = new FunctionParameter("Interval"FunctionParameter.STRING);
              
          with(fpArray[x++]){
                  
          setDefault();
              }
              
          fpArray[x] = new FunctionParameter("Interval2"FunctionParameter.STRING);
              
          with(fpArray[x++]){
                  
          setName("Optional Close Interval");
                  
          setDefault();
              }
              
          fpArray[x] = new FunctionParameter("Lookback"FunctionParameter.NUMBER);
              
          with(fpArray[x++]){
                  
          setLowerLimit(1);
                  
          setDefault(1);
              }
              
          fpArray[x] = new FunctionParameter("Type"FunctionParameter.STRING);
              
          with(fpArray[x++]){
                  
          setName("Pivot type");
                  
          addOption("Standard"); 
                  
          addOption("DeMark");
                  
          addOption("Woodie");
                  
          setDefault("Standard"); 
              }
              
          fpArray[x] = new FunctionParameter("Params"FunctionParameter.BOOLEAN);
              
          with(fpArray[x++]){
                  
          setName("Show Parameters");
                  
          setDefault(false);
              }

          var 
          bInit  false;
          var 
          xHigh  null;
          var 
          xLow   null;
          var 
          xClose null
          var 
          vPP    null;
          var 
          vR1    null;
          var 
          vS1    null;
          var 
          vR2    null;
          var 
          vS2    null;
          var 
          vR3    null;
          var 
          vS3    null
          var 
          vPPS1  null;
          var 
          vS1S2  null;
          var 
          vS2S3  null;
          var 
          vPPR1  null;
          var 
          vR1R2  null;
          var 
          vR2R3  null;  
          var 
          bInit false;
          var 
          vSymbol null;
          var 
          vSymbol2 null

          function  
          main(Symbol,Interval,Interval2,Lookback,Type,Params) {

              if(
          bInit == false){
                  if(
          isIntraday() && Interval == nullInterval "D";
                  else if(
          isDaily() && Interval == nullInterval "W";
                  else if(
          isWeekly() && Interval == nullInterval "M";
                  else if(
          Interval == nullInterval getInterval();
                  if(
          Symbol==nullSymbol getSymbol();
                  
          vSymbol Symbol+","+Interval;
                  if(
          Interval2==nullvSymbol2 vSymbol;
                  else 
          vSymbol2 Symbol+","+Interval2;
                  
          xHigh  high(sym(vSymbol));
                  
          xLow   low(sym(vSymbol));
                  
          xClose close(sym(vSymbol2)); 
                  if (
          Type=="Woodie"||Type=="DeMark"xOpen open(sym(vSymbol));
                  if (
          Type=="DeMark"){
                      
          setCursorLabelName("PP-R1",0);
                      
          setCursorLabelName("PP",1);
                      
          setCursorLabelName("PP-S1",2);
                      
          setDefaultBarFgColor(Color.blue0);
                      
          setDefaultBarFgColor(Color.black1);
                      
          setDefaultBarFgColor(Color.red2);
                      
          setDefaultBarThickness(10);
                      
          setDefaultBarThickness(11);
                      
          setDefaultBarThickness(12);
                  }
                  
          setShowTitleParameters(eval(Params));
                  
          bInit true;
              }
              
              var 
          vHigh  xHigh.getValue(-Lookback);
              var 
          vLow   xLow.getValue(-Lookback);
              var 
          vClose xClose.getValue(-Lookback); 
              
              if(
          Type == "Standard"){
              
          vPP   = (vHigh+vLow+vClose)/3;
              
          vR1   2*vPP-vLow;
              
          vS1   2*vPP-vHigh;
              
          vR2   = (vPP-vS1)+vR1;
              
          vS2   vPP-(vR1-vS1);
              
          vR3   vR2+(vHigh-vLow);
              
          vS3   vS2-(vHigh-vLow);
              
          vPPS1 = (vPP+vS1)/2;
              
          vS1S2 = (vS2+vS1)/2;
              
          vS2S3 = (vS2+vS3)/2;
              
          vPPR1 = (vPP+vR1)/2;
              
          vR1R2 = (vR2+vR1)/2;
              
          vR2R3 = (vR2+vR3)/2
              
              var 
          retArray = new Array(vR2vR1vPPvS1vS2vS3vR3vPPS1vS1S2vS2S3vPPR1vR1R2vR2R3);
           
              }else if(
          Type == "Woodie"){
                  
          vOpen  xOpen.getValue(-Lookback+1);
                  
          vPP = (vHigh+vLow+(2*vOpen))/4;
                  
          vR1 2*vPP-vLow;
                  
          vS1 2*vPP-vHigh;
                  
          vR2 = (vPP-vS1)+vR1;
                  
          vS2 vPP-(vR1-vS1);  
                  var 
          retArray = new Array(vR2vR1vPPvS1vS2); 
              }else if(
          Type == "DeMark"){
                  var 
          vOpen  xOpen.getValue(-Lookback);
                  if(
          vClose>vOpen){
                      
          vClose+vHigh+vHigh+vLow;
                  }
                  else if(
          vClose<vOpen){
                      
          vClose+vHigh+vLow+vLow;
                  }
                  else if(
          vClose==vOpen){
                      
          vClose+vClose+vHigh+vLow;
                  }
                  
          vR1 x/2-vLow;
                  
          vS1 x/2-vHigh;
                  
          vPP = (vR1+vS1)/2;
                  var 
          retArray = new Array (vR1,vPP,vS1);
              }   
              
          //Added labels
                  
              
          drawTextAbsolute(1vPP"    DAILY PP    "Color.blackColor.yellow,           
                              
          Text.FRAME Text.BOLD Text.VCENTER,"Arial"10"PivotPoint");
              
          drawTextAbsolute(1vR2"    DAILY R2    "Color.blackColor.RGB(255,200,200), 
                              
          Text.FRAME Text.BOLD Text.VCENTER,"Arial"10"R2");
              
          drawTextAbsolute(1vR1"    DAILY R1    "Color.blackColor.RGB(200,200,255), 
                              
          Text.FRAME Text.BOLD Text.VCENTER,"Arial"10"R1");
              
          drawTextAbsolute(1vS1"    DAILY S1    "Color.blackColor.RGB(200,200,255), 
                              
          Text.FRAME Text.BOLD Text.VCENTER,"Arial"10"S1");
              
          drawTextAbsolute(1vS2"    DAILY S2    "Color.blackColor.RGB(255,200,200), 
                              
          Text.FRAME Text.BOLD Text.VCENTER,"Arial"10"S2");
              
          drawTextAbsolute(1vS3"    DAILY S3    "Color.blackColor.RGB(150,150,255), 
                              
          Text.FRAME Text.BOLD Text.VCENTER,"Arial"10"S3");
              
          drawTextAbsolute(1vR3"    DAILY R3    "Color.blackColor.RGB(150,150,255), 
                              
          Text.FRAME Text.BOLD Text.VCENTER,"Arial"10"R3");
              
          drawTextAbsolute(1vPPS1,    "PPS1",        Color.blacknull,
                              
          Text.BOLD Text.VCENTER,"Arial"10"PPS1");
              
          drawTextAbsolute(1vS1S2,    "S1S2",        Color.blacknull,                                
                              
          Text.BOLD Text.VCENTER,"Arial"10"S1S2");
              
          drawTextAbsolute(1vS2S3,    "S2S3",        Color.blacknull,                                
                              
          Text.BOLD Text.VCENTER,"Arial"10"S2S3");
              
          drawTextAbsolute(1vPPR1,    "PPR1",        Color.blacknull,                                
                              
          Text.BOLD Text.VCENTER,"Arial"10"PPR1");
              
          drawTextAbsolute(1vR1R2,    "R1R2",        Color.blacknull,                                
                              
          Text.BOLD Text.VCENTER,"Arial"10"R1R2");
              
          drawTextAbsolute(1vR2R3,    "R2R3",        Color.blacknull,                                
                              
          Text.BOLD Text.VCENTER,"Arial"10"R2R3");
                  
              return (
          retArray);

          Comment


          • #6
            Both of those efs's display the pivots correctly for intraday today.

            What I would like to fix is the display for all the previous days. Right now they all display the pivots for the day that they are getting the OHLC from instead of displaying those pivots on the following day.

            Its only a problem when looking back at past days.

            Is it possible to change the efs's where they display the pivots historically on the days they were computed for instead of the days they were computed on?

            Thanks

            Comment


            • #7
              I just checked it on a stock and it appears to display correctly there.

              I trade using the symbol ES #F=2 and for all previous days don't display correctly.

              Comment


              • #8
                ricks231

                Right now they all display the pivots for the day that they are getting the OHLC from instead of displaying those pivots on the following day
                In both scripts included in this thread the pivots are calculated using the prior day's data. To use your own wording the pivots are displayed on the following day and not on the day from which they are getting the data.

                I trade using the symbol ES #F=2 and for all previous days don't display correctly
                First of all note that the two scripts compute the pivots in different ways which could return slightly different results.
                One script uses the High, Low and Close of the prior daily bar (unless otherwise defined in its settings). In this case the Close will include the Settlement.
                The other script uses only the High and Low from the prior daily bar and for the Close it uses the last intraday Close displayed on the chart at the prior day. Depending on the Time Template settings this may return a different value from the daily Close as it may not include the Settlement. Because this script relies on the change of day to determine the value of the Close it should be used only with regular trading hours charts. Also it may return different results with tick based charts (ie intervals T, V, S and P) as these do not currently make use of the Start/End times in the Time Template and display the data in whole day segments only.
                Anyhow as far as I can see both scripts are calculating the pivots correctly on ES #F=2 intraday data
                In the following images you can see the scripts running on two 15 minute charts of ES #F=2. In both charts the cursor is positioned on October 31st and the values shown in the Cursor Window for the Pivot Point, R1 and S1 are 1383.00, 1387.25 and 1379.00 respectively.


                The High, Low and Close values for October 30th were 1387.00, 1378.75 and 1383.25 respectively.
                Again note that depending on the Time Template settings the last Close on the intraday chart may not be the same as the Close of the daily bar which includes the Settlement. Using the above values to calculate the Pivot Point we get the following
                (1387.00+1378.75+1383.25)/3 = 1383.00
                which is in fact the value of the Pivot Point returned by the script(s)
                If we then calculate R1 and S1 we have the following
                (2*1383.00)-1378.75 = 1387.25
                (2*1383.00)-1387.00 = 1379.00
                Again these are the same values returned by both script(s) for R1 and S1.
                If you are getting different values please post a detailed account of the math you are using to determine these values and all the necessary information regarding the set up of the chart (ie symbol, Time Tremplate settings, etc).
                Alex

                Comment


                • #9
                  Thanks.

                  I can see where I got off track; I just have not yet been able to figure out how I got off.

                  Appreciate the response and appreciate the pivot point efs.

                  Comment


                  • #10
                    ricks231
                    You are most welcome
                    Alex

                    Comment

                    Working...
                    X