Announcement

Collapse
No announcement yet.

EFS Interval pricing discrepancy

Collapse
X
 
  • Filter
  • Time
  • Show
Clear All
new posts

  • EFS Interval pricing discrepancy

    I started to notice some discrepancies in my EFS study which is based on the OHLC.efs that I found in this forum. This was just what I was looking for, but my problem began when I noticed a difference on the Open/Close pricing levels.

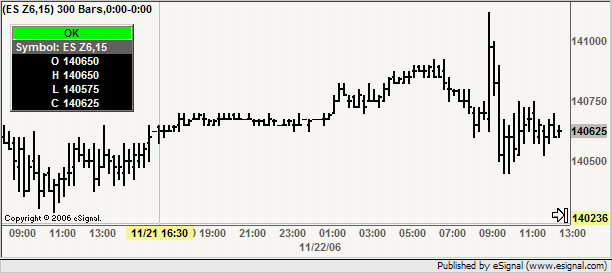
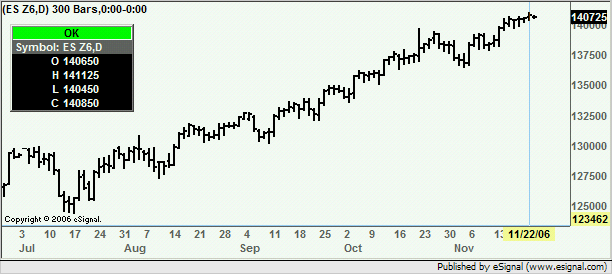
    For example, on Tue 22nd Nov, the Daily ES#F is showing the O=140650 and C=140850. However if you go to the 15Min interval, the Open of that bar is 140675.

    I found going back over quite a few days that there was 1tick discrepancy between the 15min bar Open value, and the value being calculated from the Daily Open used to plot the OHLC lines.

    The Close plots and High/Low plots do seem to be correct so far as I can see.

    I though I would also check the ES#f=2 to compare the values there, but again I found larger price variances in the reported Open price. Could someone please explain as I need to make sure I select the correct reference for my EFS code.

  • #2
    Kardinal
    What are the settings of the Time Template on your 15 minute chart?
    What is the time stamp of the bar on which you are seeing an Open of 140675? (also what Time Zone are you in?)
    From what I am seeing here the Open at 16:30 ET on November 21 is 140650 which is the same value of the daily bar for November 22 (see enclosed images).
    Alex


    Comment


    • #3
      Thanks for your quick reply... I'm based in the UK. The Time Stamp of the bar is 14:30 (09:30 + 5hrs). The Time Template is set to '24 Hours' (I-Default, Dynamic, 0:00 - 0:00). My daily chart does agree with your OHLC values, so the variance appears to be in the lower time frames.

      I have attached a screenshot of the 15m chart and a 5m chart which both show the same price level.
      Attached Files
      Last edited by Kardinal; 11-23-2006, 10:01 AM.

      Comment


      • #4
        {Couldn't get second image to attach to original posting, so here is the second image}
        Attached Files
        Last edited by Kardinal; 11-23-2006, 10:06 AM.

        Comment


        • #5
          Kardinal
          The bar you are looking at is not the first bar of the E-mini S&P session of November 22. The first bar of that session (when using ES Z6 or ES #F) is on November 21 at 16:30 ET which should correspond to your 21:30 (see the intraday chart in my previous message)
          Alex

          Comment


          • #6
            OK - I understand how it works now... Is the ES#F=2 the Day session only symbol. In which case, the quoted open value is 140725.

            What I'm trying to achieve is a HiLo plot on the ES#F 15m based on yesterdays 09:30 - 4:15 (EST) Open/Close. The close it working fine, its just the open that was causing me a challenge.

            Comment


            • #7
              Kardinal

              Is the ES#F=2 the Day session only symbol.
              Yes. ES #F=2 is the symbol for the day session.
              Alex

              Comment

              Working...
              X