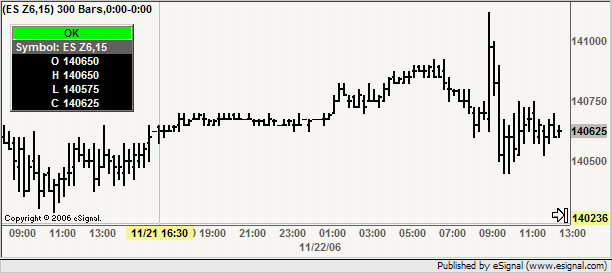
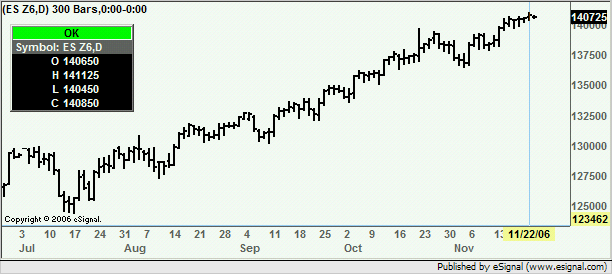
I started to notice some discrepancies in my EFS study which is based on the OHLC.efs that I found in this forum. This was just what I was looking for, but my problem began when I noticed a difference on the Open/Close pricing levels.
For example, on Tue 22nd Nov, the Daily ES#F is showing the O=140650 and C=140850. However if you go to the 15Min interval, the Open of that bar is 140675.
I found going back over quite a few days that there was 1tick discrepancy between the 15min bar Open value, and the value being calculated from the Daily Open used to plot the OHLC lines.
The Close plots and High/Low plots do seem to be correct so far as I can see.
I though I would also check the ES#f=2 to compare the values there, but again I found larger price variances in the reported Open price. Could someone please explain as I need to make sure I select the correct reference for my EFS code.


Comment