I am trying to modify the efs provided by another user.
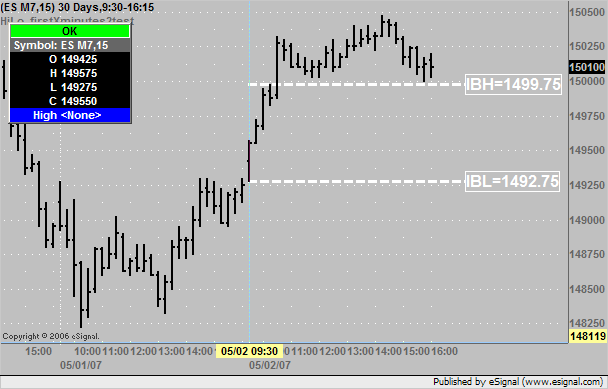
I just want to plot the High and Low of first 60 minutes of today ONLY. I have eliminated user defined inputs.
I would like to drawtext with valuel for the hight and low to the right of the line.
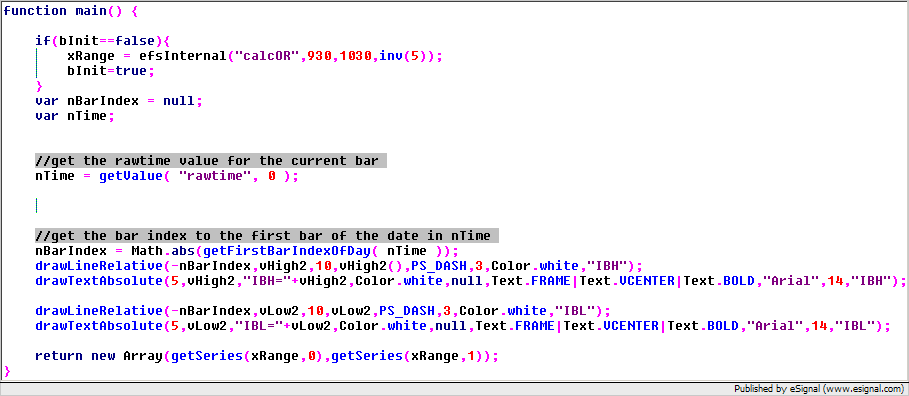
I modified the efs as below, but do not get the result. Can anybody point out the correct way to do it.
I just want to plot the High and Low of first 60 minutes of today ONLY. I have eliminated user defined inputs.
I would like to drawtext with valuel for the hight and low to the right of the line.
I modified the efs as below, but do not get the result. Can anybody point out the correct way to do it.


Comment