Announcement

Collapse
No announcement yet.

Modifying HILofirstminutes.efs

Collapse
X
 
  • Filter
  • Time
  • Show
Clear All
new posts

  • Modifying HILofirstminutes.efs

    I am trying to modify the efs provided by another user.

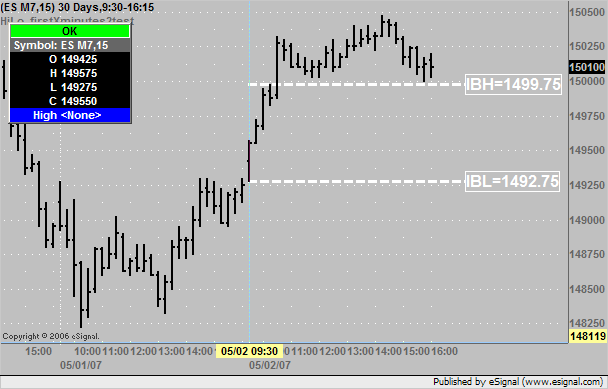
    I just want to plot the High and Low of first 60 minutes of today ONLY. I have eliminated user defined inputs.
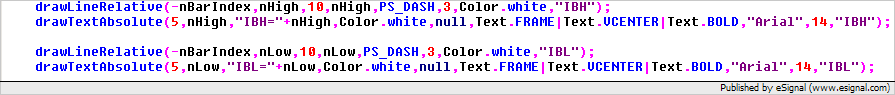
    I would like to drawtext with valuel for the hight and low to the right of the line.

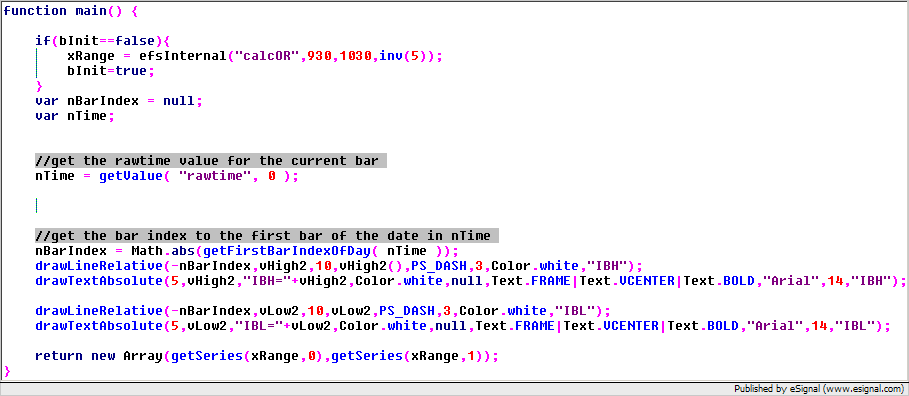
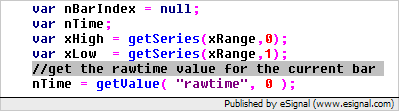
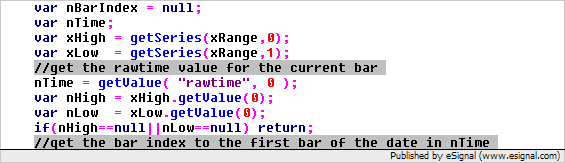
    I modified the efs as below, but do not get the result. Can anybody point out the correct way to do it.
    Attached Files
    Last edited by akiri; 04-23-2007, 06:14 PM.

  • #2
    akiri
    See this thread for a code example of how to plot values on the current day only which you can apply to the original version of the script you posted.
    Alex

    Comment


    • #3
      Still Unable to figure out the code

      Thanks for the help, Alexis, I am still unable to figure out the code. I have tried the logic and it seems there is something missing in my understanding.

      I have started to go thru the lessons on efs - java programming
      but its gonna be a while for me to start comprehending it.

      I have not been able to draw the lines and text as posted in the efs earlier either. Meanwhile If anybody could give me a different hint or has been able to correct the code could u please post it here. Thanks

      AK

      Comment


      • #4
        EFS Internal

        When using efs internal should the draw text and draw line statement be right below the efs internal statement or inside the function calcOR that is being called by the efsinternal.

        Any help would be appreciated. Thanks

        AK

        Comment


        • #5
          akiri

          Thanks for the help, Alexis, I am still unable to figure out the code. I have tried the logic and it seems there is something missing in my understanding.
          The sections of code I provided at the linked thread are self contained and all you need to do is cut and paste them into the original hilo_firstxminutes2.efs (or any working efs for that matter) and it will plot the values for the current day only.

          Meanwhile If anybody could give me a different hint or has been able to correct the code could u please post it here.
          There are several errors in that script.
          The added code was incorrectly placed after the return statement in line 118. In efs anything that comes after the return statement will not be executed.
          More importantly though that whole section of code should be in the main() function of the script and not in the calcOR() function.
          Here are the steps you need to take to correct these errors
          1) Comment out or delete the content in lines 127, 137 and 138 as they will no longer be required (for the purpose of this example I will be deleting the contents)
          2) Cut the section of code contained in lines 120-135 and Paste it in the main() function after the bInit routine and before the return statement of that function. The main() function should look like this


          3) Create two new variables called xHigh and xLow that will be used to store the two series created by the efsInternal() function and that correspond to the two elements returned by the called function. Insert these variables as shown below


          4) Create two other variables called nHigh and nLow which are used to store the current values of the xHigh and xLow series and run a null check on these variables.


          5) In the drawLineRelative() and drawTextAbsolute() commands replace every instance of vHigh2 and vLow2 with nHigh and nLow as shown in the following image. As an aside note that the fourth parameter in your drawLineRelative() command was incorrectly written vHigh2() instead of vHigh2


          6) Remove all items from the return statement as they will no longer be plotted


          7) Save the script and load it in a chart and you should see it work correctly.
          Alex

          Comment


          • #6
            Thanks Alexis again

            Thanks again Alexis. I had found another script that worked as long as I kept the chart interval below daily, but this alows me to change to any interval without having to worry about changed values.

            Your explanation helped me understand the logic too.
            Thanks again.
            AK

            Comment


            • #7
              akiri
              You are most welcome
              Alex

              Comment

              Working...
              X