Announcement

Collapse
No announcement yet.

Auto-updating of indicators

Collapse
X
 
  • Filter
  • Time
  • Show
Clear All
new posts

  • Auto-updating of indicators

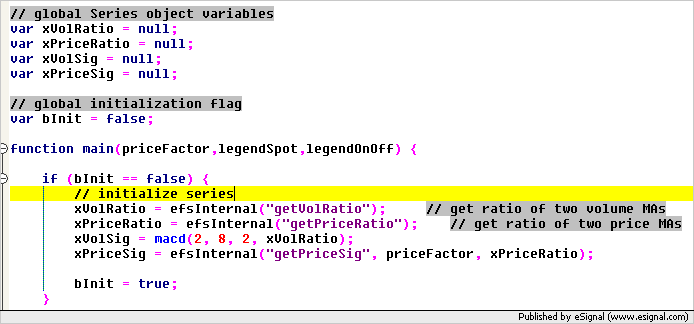
    The idea behind this script is to create a running "thermometer" reporting the bullishness or bearishness, moment to moment, of whatever is being charted. It attempts to do this by combining two very short-term oscillators, one of volume and one of price, on a one or two-minute chart.

    If the volume oscillator rises when the price average rises, that's bullish and gets recorded on the screen and in an array as a "b". On the other hand, if volume rises as the price oscillator moves lower, that gets recorded as an "s." Then, in a corner of the chart, the script attempts to report the running count it keeps and also the proportional breakdown.

    My problem, as is visible in the attached graphic (showing before and after reloading), is that the program doesn't update automatically and gets way behind. To find out what the current reading is (for whatever that's actually worth), I have to repeatedly reload the script. Not sure what's wrong....

    Any help would be appreciated.
    Attached Files
    Last edited by Steven Miller; 06-13-2007, 07:05 PM.

  • #2
    Here is the script in question.
    Attached Files

    Comment


    • #3
      Hello Steven,

      The problem with the "b" and "s" labels not being drawn has to do with the formula logic revolving around your variables volSig1, oldVolSig, oldVolSig2, priceSig1, oldPriceSig and oldPriceSig2.

      In real time while the formula is processing tick-by-tick, your conditions are not evaluating to true. Therefore, it cannot draw any of the expected labels. This is happening because when your formula is loading (or reloaded) the formula only processes each historical bar one time, which are completed bars. The bar state returned by getBarState() during historical processing is BARSTATE_NEWBAR. On the historical bars, your variables are referring to the completed bar data for the current and previous bars. In real time, your variables are no longer referring to completed bar data. They are referring to the values at the open of the real time bar, which is the only instance where your conditions to draw the labels occurs. On the subsequent trades that occur for the real time bar the values of the variables are reassigned to values of previous trades and not the previous bars as it does after processing historical bars upon reload.

      The first suggestion that will help simplify the coding is to first assign all of your indicators into global series object variables. Something like below.


      This will make it easier to retrieve the previous bar values of these indicators for your conditional statements. The global initialization flag is used to allow the initialization of the series objects to be executed only once at start-up. Notice also the new efsInternal call to getPriceSig() for your xPriceSig indicator. This accomplishes the same calculation, but in a more efficient manner. Here's the code for getPriceSig().


      Once you have all your indicators established, retrieve all the values you need for your conditional statements using the .getValue(nBarIndex) of the Series Object.


      Assigning the values to your variables this way insures that they will be referring to previous bar values during historical processing as well as real time processing.

      Since your conditions for drawing the "b" and "s" labels are inside a check for BARSTATE_NEWBAR your conditions will now evaluate the previously closed bars at the open of each new bar in real time, which should duplicate how the labels are drawn if you reload the chart later.

      Try these changes first. You may not need to make any changes to your conditional statements if these changes produce the results you were expecting.
      Jason K.
      Project Manager
      eSignal - an Interactive Data company

      EFS KnowledgeBase
      JavaScript for EFS Video Series
      EFS Beginner Tutorial Series
      EFS Glossary
      Custom EFS Development Policy

      New User Orientation

      Comment


      • #4
        Fantastic! Thank you, Jason.

        Steve

        Comment


        • #5
          You're most welcome.
          Jason K.
          Project Manager
          eSignal - an Interactive Data company

          EFS KnowledgeBase
          JavaScript for EFS Video Series
          EFS Beginner Tutorial Series
          EFS Glossary
          Custom EFS Development Policy

          New User Orientation

          Comment

          Working...
          X