 Tweet
Tweet
Can anyone help with this?
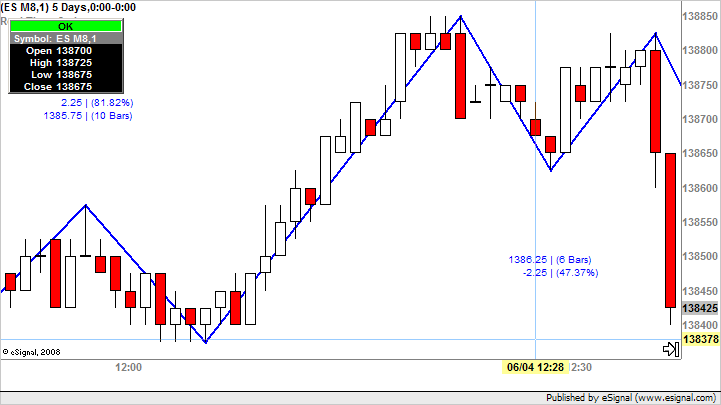
I would like to be able to plot the lines of an indicator...such as the swing tool etc...BEHIND my candlesticks...not on top of them which of course covers them up... "Unchecking" the choice to draw lines ontop of price within the properties menue does not accomplish this for most indicators. Also, are any transparent colors possible..such as those in Ninja Trader?
Thank in advance for any suggestions!
Comment