Announcement

Collapse
No announcement yet.

EFS indicator plotting

Collapse
X
 
  • Filter
  • Time
  • Show
Clear All
new posts

  • EFS indicator plotting

    Can anyone help with this?

    I would like to be able to plot the lines of an indicator...such as the swing tool etc...BEHIND my candlesticks...not on top of them which of course covers them up... "Unchecking" the choice to draw lines ontop of price within the properties menue does not accomplish this for most indicators. Also, are any transparent colors possible..such as those in Ninja Trader?

    Thank in advance for any suggestions!
  • #2
    shm000
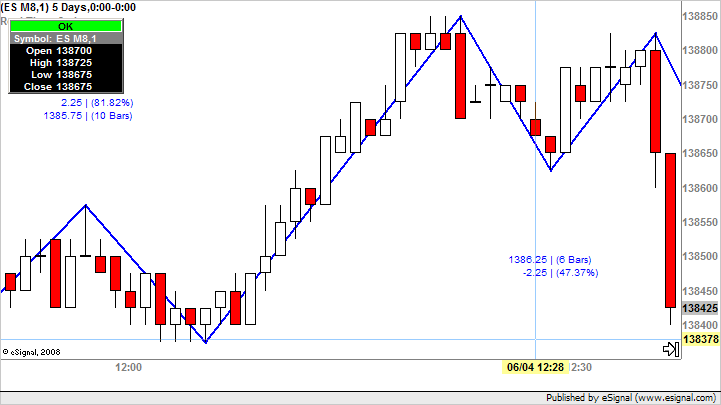
    The latest version of eSignal 10.1 RC2 (see this post for the details regarding this release) allows you to determine through Edit Studies the z-order of the plots returned by the scripts to the chart. This functionality however does not apply to lines drawn using the drawLineXxx() functions which are always drawn on top of price.
    In the latter case there is a workaround which is to set the study as a non-price study and then overlay it on the price pane. Once you do this you can also determine the z-order of the overlayed studies with the result that the lines drawn using the drawLineXxx() functions display behind the candles as you can see in the enclosed screenshot
    Alex


    Originally posted by shm000
    Can anyone help with this?

    I would like to be able to plot the lines of an indicator...such as the swing tool etc...BEHIND my candlesticks...not on top of them which of course covers them up... "Unchecking" the choice to draw lines ontop of price within the properties menue does not accomplish this for most indicators. Also, are any transparent colors possible..such as those in Ninja Trader?

    Thank in advance for any suggestions!

    Comment


    • #3
      Thanks!

      Thank you for your quick reply...I will try what you suggest.

      Thanks!

      Comment


      • #4
        Quick Question regarding plot

        Thanks Alexis...your suggestion worked. I now have newer eSignal version and have put my swings behind price by creating a non-price study and overlaying it...my only trouble is that now, the " price | bars " and " pts | % Ret" are now NOT plotted above the swing highs and lows, they are forced all the way to the top of the creen on one horizantal line...and therefore are not usable. I see that in your example they are correct. Any further suggestion? Sorry, I'm notmuch of an .efs programmer...yet

        Thanks again

        S

        Comment


        • #5
          I found it..

          Thank you Alexis...I just answered my own question...no need to reply...plot is working as usual.

          Thanks again!

          Comment


          • #6
            Re: Thanks!

            shm000
            My pleasure
            Alex

            Comment

            Working...
            X