 Tweet
Tweet
I'm wondering if anybody can help me with this:
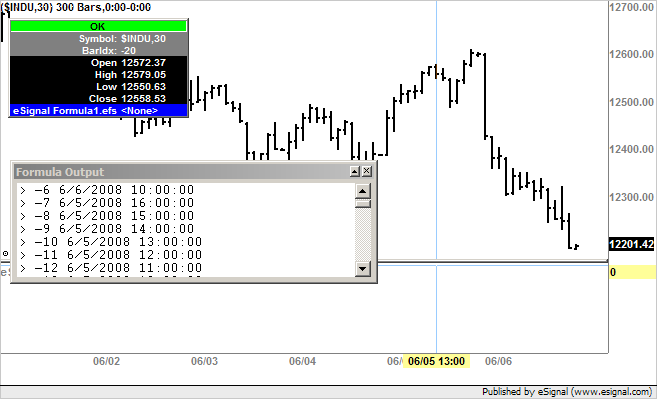
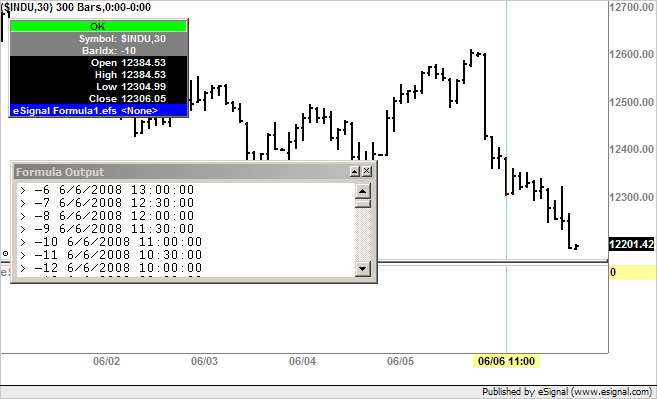
When I try the above on a 30 minute chart I get 60 minute intervals and on a 20 minute chart 40 minute intervals...
Code:
function main() {
	var i = getCurrentBarIndex();
	var dayD = getValue("day", i);
    var monthD = getValue("month", i);
    var yearD = getValue("year", i);

    var hourT = getValue("hour", i);
    var minuteT = getValue("minute", i);
    if(hourT < 10) {
        hourT = "0" + hourT;
    }
    if(minuteT < 10) {
        minuteT = "0" + minuteT;
    }

    var writeString = monthD + "/" + dayD + "/" + yearD + " " + hourT + ":" + minuteT + ":00";
	debugPrintln("> " + i + " " + writeString);

}

Comment