Announcement

Collapse
No announcement yet.

Time problem

Collapse
X
 
  • Filter
  • Time
  • Show
Clear All
new posts

  • Time problem

    I'm wondering if anybody can help me with this:
    Code:
    function main() {
    	var i = getCurrentBarIndex();
    	var dayD = getValue("day", i);
        var monthD = getValue("month", i);
        var yearD = getValue("year", i);
    
        var hourT = getValue("hour", i);
        var minuteT = getValue("minute", i);
        if(hourT < 10) {
            hourT = "0" + hourT;
        }
        if(minuteT < 10) {
            minuteT = "0" + minuteT;
        }
    
        var writeString = monthD + "/" + dayD + "/" + yearD + " " + hourT + ":" + minuteT + ":00";
    	debugPrintln("> " + i + " " + writeString);
    
    }
    When I try the above on a 30 minute chart I get 60 minute intervals and on a 20 minute chart 40 minute intervals...
    Standing on the shoulders of giants.

  • #2
    wildfiction
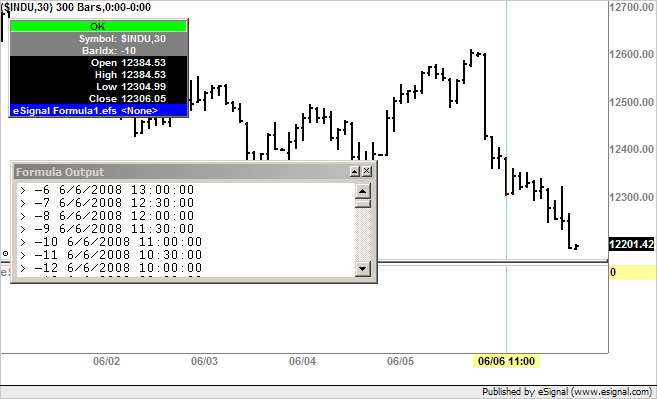
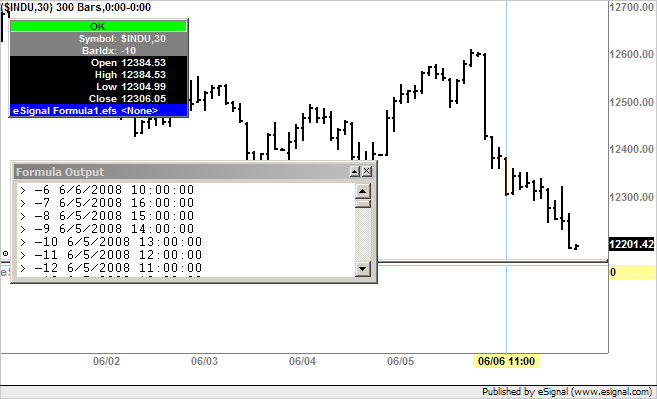
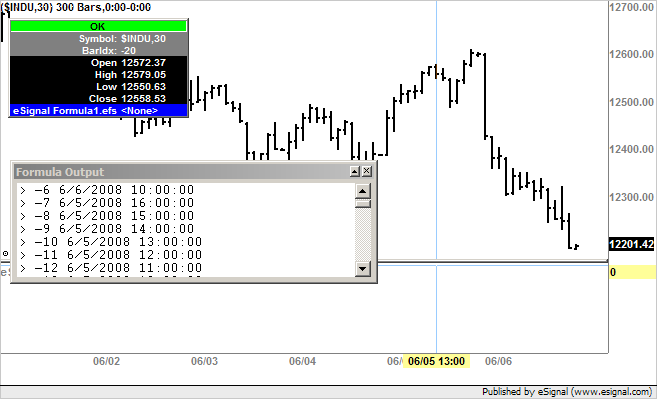
    getValue() retrieves the value that is relative to the current bar index being processed. So for example when the formula is processing bar index -10 and you pass that bar index to the getValue() call you are actually retrieving the values of 10 bars back relative to the bar being processed in other words the values at bar index -20
    In the following screenshot you can see that in the Formula Output window the date and time values for -10 are 6/5/2008 13:00:00. In the chart the cursor is located on bar index -10 however as you can see the date and time values for that bar are 6/6/2008 11:00:00.


    In the next screenshot the cursor is located 10 bars back relative to bar index -10 and as you can see the values match those shown in the Formula Output window ie 6/5/2008 13:00:00


    In order to retireve the value corresponding to the bar being processed you need to replace the getValue() calls with getValueAbsolute() as this function retrieves the values from the absolute bar index that is specified. Alternatively replace i with 0 in the getValue() calls eg getValue("minute", 0)
    Once you make either of these changes you should see the expected values in the Formula Output window (see screenshot enclosed below)
    Alex


    Originally posted by wildfiction
    I'm wondering if anybody can help me with this:
    Code:
    function main() {
     var i = getCurrentBarIndex();
     var dayD = getValue("day", i);
        var monthD = getValue("month", i);
        var yearD = getValue("year", i);
    
        var hourT = getValue("hour", i);
        var minuteT = getValue("minute", i);
        if(hourT < 10) {
            hourT = "0" + hourT;
        }
        if(minuteT < 10) {
            minuteT = "0" + minuteT;
        }
    
        var writeString = monthD + "/" + dayD + "/" + yearD + " " + hourT + ":" + minuteT + ":00";
     debugPrintln("> " + i + " " + writeString);
    
    }
    When I try the above on a 30 minute chart I get 60 minute intervals and on a 20 minute chart 40 minute intervals...

    Comment


    • #3
      Thanks for the detailed reply and explanation Alexis - as always, much appreciated!
      Standing on the shoulders of giants.

      Comment


      • #4
        wildfiction
        You are most welcome
        Alex


        Originally posted by wildfiction
        Thanks for the detailed reply and explanation Alexis - as always, much appreciated!

        Comment

        Working...
        X