Announcement

Collapse
No announcement yet.

Works on interval charts, late start on seconds chart and not at all on tick charts

Collapse
X
 
  • Filter
  • Time
  • Show
Clear All
new posts

  • Works on interval charts, late start on seconds chart and not at all on tick charts

    Hi. Does anyone know why this short program will work on a 1 minute emini (es #f) chart returning values the first couple of ticks after the opening while is does not return values until 100 minutes after the opening on a 60 seconds chart and returns no values at all on a tick chart (e.g. 200t) of any length? It calculates a 100 period simple moving average of the Spx (S&P 500 cash). The Spx value is transmitted every 15 seconds and the 100 periods is based on those intervals even though the study is on an emini chart. Any help would be appreciated.

    Mike

    var myArray = new Array(100);
    var binit = false;
    var x = 0;
    var Spx;
    var SpxPrev =0;
    var Sum = 0;
    var Avg = 0;

    function preMain() {
    setStudyTitle("Spx Reteive Test");
    setPriceStudy(false);
    }

    function main(){

    if(binit == false){
    for(x = 0; x < 100; x++) {
    myArray[x] = close(sym("$spx"));
    }
    binit = true;
    }

    Sum = 0;
    Avg = 0;

    SpxPrev = Spx;

    Spx = close(sym("$spx"));

    if(SpxPrev != Spx){
    myArray.shift();
    myArray.push(Spx);
    }

    for(x = 0; x < 100; x++){
    Sum += myArray[x];
    Avg = Sum/100;
    }

    return Avg;
    }
  • #2
    Re: Works on interval charts, late start on seconds chart and not at all on tick char

    Mike
    FWIW if you are trying to calculate a 100 period average of an external symbol then you may first need to review the logic you are using to compute that average as it is not calculating correctly when the script is running in real time (unless you have enabled the global compute on close option in the EFS Preferences).
    Based on what I am seeing the formula is calculating the average of the last 100 ticks of the external symbol instead of 100 bars because you are updating the array on every tick rather than on every bar. You can verify this by reloading the script at any time after it has been running for a while and you will see that the plot will change. This is because when you reload the script it will calculate correctly once per bar only on historical data.
    Regardless it would be far simpler and more efficient if you just calculated the average of the external symbol using the appropriate efs2 function eg sma(100, sym("$spx"))
    Alex


    Originally posted by mikejhelms
    Hi. Does anyone know why this short program will work on a 1 minute emini (es #f) chart returning values the first couple of ticks after the opening while is does not return values until 100 minutes after the opening on a 60 seconds chart and returns no values at all on a tick chart (e.g. 200t) of any length? It calculates a 100 period simple moving average of the Spx (S&P 500 cash). The Spx value is transmitted every 15 seconds and the 100 periods is based on those intervals even though the study is on an emini chart. Any help would be appreciated.

    Mike

    var myArray = new Array(100);
    var binit = false;
    var x = 0;
    var Spx;
    var SpxPrev =0;
    var Sum = 0;
    var Avg = 0;

    function preMain() {
    setStudyTitle("Spx Reteive Test");
    setPriceStudy(false);
    }

    function main(){

    if(binit == false){
    for(x = 0; x < 100; x++) {
    myArray[x] = close(sym("$spx"));
    }
    binit = true;
    }

    Sum = 0;
    Avg = 0;

    SpxPrev = Spx;

    Spx = close(sym("$spx"));

    if(SpxPrev != Spx){
    myArray.shift();
    myArray.push(Spx);
    }

    for(x = 0; x < 100; x++){
    Sum += myArray[x];
    Avg = Sum/100;
    }

    return Avg;
    }

    Comment


    • #3
      Alex wrote “Based on what I am seeing the formula is calculating the average of the last 100 ticks of the external symbol instead of 100 bars because you are updating the array on every tick rather than on every bar.” True. But since a $SPX value is transmitted only once every 15 seconds, a 15 second bar is the roughly the equivalent of a tick. So when I wrote that the study generates “a 100 period simple moving average of the Spx”, the period I was referring to was fifteen seconds which is, you're right, essentially a tick chart in the case of the $Spx. Also, I’m not running this study in real time. It’s an attempt to do an analysis after hours.

      Here’s the question: After hours how can the SMA value of the last 100 ticks of $SPX be incorporated into a study that is on a 200t chart of the emini? In real time it can be calculated on a tick chart of the $Spx and globalized, but after hours that isn’t possible. If I was working with a 15 second chart of the emini, using sma(100,sym(“$spx”)) as suggested would work after hours. But on a 200t emini chart the average generated would be based on the one hundred 200t bars of the emini, not the last 100 ticks/15 second bars of the Spx. (Actually sma(100,sym(“$spx”)) returns no values on a 200t emini chart as far as I can see.) So my approach was to try to generate an array which in replay would compensate for the different time intervals. Unfortunately although a standard SMA100 of $Spx on a 15 second emini chart produces virtually the same values as a SMA100 on a $SPX tick chart, my study does not. But even if I eventually get it to generate the correct values, the question still remain why neither my study or a standard sma(100,sym(“$spx”)) return no values on a 200t emini chart? Any comments would be appreciated.

      Mike

      Comment


      • #4
        temp

        Mike

        the question still remain why neither my study or a standard sma(100,sym(“$spx”)) return no values on a 200t emini chart? Any comments would be appreciated.
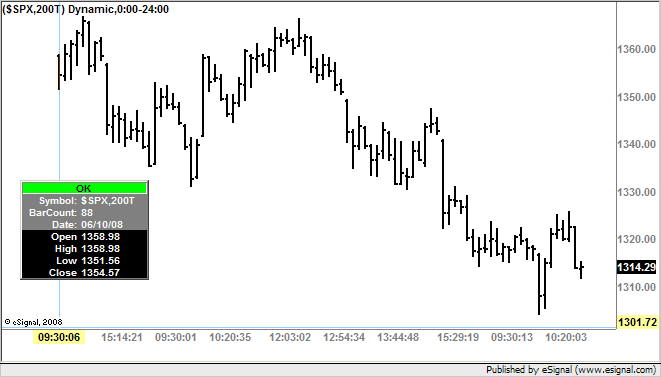
        Because on a 200T chart of $SPX [which is the external symbol/interval you are calling] there are only 88 bars available in all of the 10 days of tick data provided by eSignal (notice the BarCount value in the Cursor Window) and you need 100 bars to calculate a 100 period moving average.
        You would have to base the external symbol on a lower interval that would approximate a 200T time frame of ES.
        Alex


        Originally posted by mikejhelms
        Alex wrote “Based on what I am seeing the formula is calculating the average of the last 100 ticks of the external symbol instead of 100 bars because you are updating the array on every tick rather than on every bar.” True. But since a $SPX value is transmitted only once every 15 seconds, a 15 second bar is the roughly the equivalent of a tick. So when I wrote that the study generates “a 100 period simple moving average of the Spx”, the period I was referring to was fifteen seconds which is, you're right, essentially a tick chart in the case of the $Spx. Also, I’m not running this study in real time. It’s an attempt to do an analysis after hours.

        Here’s the question: After hours how can the SMA value of the last 100 ticks of $SPX be incorporated into a study that is on a 200t chart of the emini? In real time it can be calculated on a tick chart of the $Spx and globalized, but after hours that isn’t possible. If I was working with a 15 second chart of the emini, using sma(100,sym(“$spx”)) as suggested would work after hours. But on a 200t emini chart the average generated would be based on the one hundred 200t bars of the emini, not the last 100 ticks/15 second bars of the Spx. (Actually sma(100,sym(“$spx”)) returns no values on a 200t emini chart as far as I can see.) So my approach was to try to generate an array which in replay would compensate for the different time intervals. Unfortunately although a standard SMA100 of $Spx on a 15 second emini chart produces virtually the same values as a SMA100 on a $SPX tick chart, my study does not. But even if I eventually get it to generate the correct values, the question still remain why neither my study or a standard sma(100,sym(“$spx”)) return no values on a 200t emini chart? Any comments would be appreciated.

        Mike

        Comment


        • #5
          Calling on data that doesn't exist... hmmm. Yeah, I suppose that could present a problem.
          Thanks.

          Comment

          Working...
          X