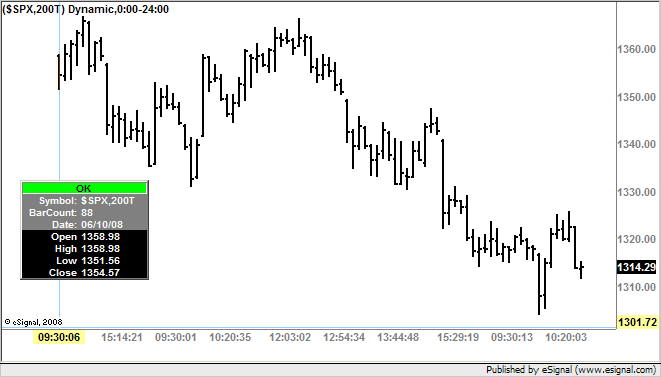
Hi. Does anyone know why this short program will work on a 1 minute emini (es #f) chart returning values the first couple of ticks after the opening while is does not return values until 100 minutes after the opening on a 60 seconds chart and returns no values at all on a tick chart (e.g. 200t) of any length? It calculates a 100 period simple moving average of the Spx (S&P 500 cash). The Spx value is transmitted every 15 seconds and the 100 periods is based on those intervals even though the study is on an emini chart. Any help would be appreciated.
Mike
var myArray = new Array(100);
var binit = false;
var x = 0;
var Spx;
var SpxPrev =0;
var Sum = 0;
var Avg = 0;
function preMain() {
setStudyTitle("Spx Reteive Test");
setPriceStudy(false);
}
function main(){
if(binit == false){
for(x = 0; x < 100; x++) {
myArray[x] = close(sym("$spx"));
}
binit = true;
}
Sum = 0;
Avg = 0;
SpxPrev = Spx;
Spx = close(sym("$spx"));
if(SpxPrev != Spx){
myArray.shift();
myArray.push(Spx);
}
for(x = 0; x < 100; x++){
Sum += myArray[x];
Avg = Sum/100;
}
return Avg;
}

Comment