Announcement

Collapse
No announcement yet.

efsInternal returning null causes data shift

Collapse
X
 
  • Filter
  • Time
  • Show
Clear All
new posts

  • efsInternal returning null causes data shift

    PHP Code:
    // 10.1.1057
    // If an efsInternal series returns some data and then starts to return nuls, the
    // plot of an sma of earlier data is offset forwards in time to "eliminate" the gap.
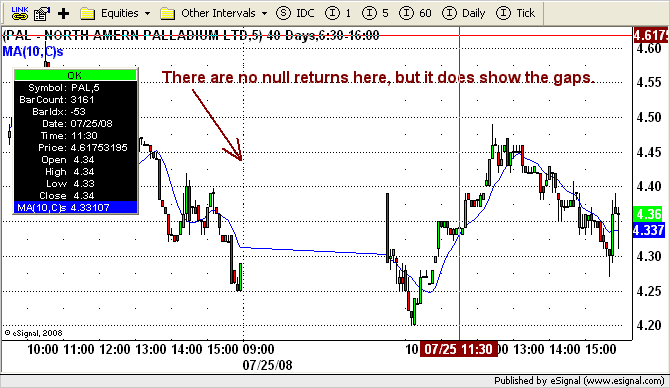
    // Plotting the data (rather than the sma()) shows the expected gap.
    //
    // This situation occurs when processing "sparse" data.
    //
    // ema() also fails, presumably this is a general "series of a series" bug?

    function preMain() {
        
    setCursorLabelName("close()",0);
        
    setDefaultBarFgColor(Color.blue,0);
        
    setCursorLabelName("sma(close(),2)",1);
        
    setDefaultBarFgColor(Color.aqua,1);
        
    setCursorLabelName("close()WithNulls",2);
        
    setDefaultBarFgColor(Color.purple,2);
        
    setCursorLabelName("sma(close()WithNulls",3);
        
    setDefaultBarFgColor(Color.red,3);
    }
    function 
    main() {

    var 
    s1 efsInternal("closeWithDayofNuls"); // returns close(0), but on previous day returns null

    // return (with multipliers to make them visible): 
    //   the close(), 
    //   the sma() of the close(), 
    //   the close() with the day's nulls, and
    //   the sma() of that series with the nulls
    // expect the smas to be in phase with one having a "gap" where price also has a "gap"

    // This is best plotted on a fixed day count  time template (3 to 5 days).

    // See that the sma of the "gap" does not start at the left like all the other lines, as it appears that the gap 
    // has been joined up and the line aligned to the right. 
    // So the data to the left of the gap is wrong.

    return new Array(close(0), 0.9 sma(2,close(0)), 0.8 s10.7 sma(2,s1)); 
    }

    function 
    closeWithDayofNuls() {
        var 
    = new Date();
        if (
    day(0) == (d.getDate() - 1) )
            return 
    null// for previous day return null, so expect to see a gap in the plot for that day
        
        
    return close(0);
            

    Attached Files

  • #2
    Hello Dave,

    I do see the shift in the series you're referring to. It appears to be caused by inserting nulls into the middle of the series. The efs engine handles synchronization for you in the case were a symbol may have white space due to infrequency of trading. I'm not sure why any explicit null values would need to be returned in the middle of an efsInternal series as you are in your example. Can you please explain the case in which you need to do this?
    Jason K.
    Project Manager
    eSignal - an Interactive Data company

    EFS KnowledgeBase
    JavaScript for EFS Video Series
    EFS Beginner Tutorial Series
    EFS Glossary
    Custom EFS Development Policy

    New User Orientation

    Comment


    • #3
      Hi Jason

      // This situation occurs when processing "sparse" data.

      The data is not available/valid for certain time periods, hence the need to show that it is absent.
      Not that dissimilar from when data is not available at the start of a chart because an indicator does not yet have enough candles to produce a result.

      Dave

      Comment


      • #4
        Hello Dave,

        I understand the situation of "sparse" data. What I don't understand is why you need to return null values from within an efsInternal series in between valid data for the series. This is the source of the problem as I currently understand it. The series array cannot insert a null element as this would cause a problem for the calculation. For example, if the null elements were inserted into the array then a 2-period MA of this series would return zeros ( (null + null) /2 = 0 ). Which in turn would drop the indicator plot to zero. In the event you have at least one null with a valid data element the calculation would not be an accurate reflection of the source ( (null + 5) / 2 = 2.5).

        In the example you've posted, your efsInternal series is explicitly returning nulls, which is not a practical use case as I see it. Have you encountered some specific efsInternal algorithm that requires explicit null returns in between valid data? This should not be necessary. Or have you encountered a case where the algorithm itself is resulting in null calculations? If so, please detail this case so that we can investigate further.
        Jason K.
        Project Manager
        eSignal - an Interactive Data company

        EFS KnowledgeBase
        JavaScript for EFS Video Series
        EFS Beginner Tutorial Series
        EFS Glossary
        Custom EFS Development Policy

        New User Orientation

        Comment


        • #5
          Hi Jason,
          Well I agree that an ma would be invalid for as many bars after the last data null as the ma period. But what is wrong with that? In turn I would expect the ma to return null too until it has data (like it does at the start (LHS) of a chart).

          As I said, the data is sparse, hence indicators should also be sparse while they are waiting for enough bars to produce a result.

          My example efs merely uses a simple "day" test to generate the null data. A more realistic example would be where data is invalid during the first N minutes of each trading day, does that make more sense?

          Comment


          • #6
            Hello Dave,

            I think that the expectation you have for sparse data is incorrect. Any series algorithm that requires a certain number of bars to prime its calculation will result in null at the first x number of bars, but not after that point. Once the series has been primed it will continue to return valid data, which will be based on the bar data that is present. In the case of a sparsely traded security where a 1-min chart could have several 1-min intervals with no trades, there will be no bar data for that period. A 2-period SMA for example would be based on the last two bars of data that did have trades regardless of the 3 non-existent intervals that had no trades.

            Indicators are not going to show this sparse concept that you're looking for, because they are based only on data that is present in the chart. Even if we did somehow include null returns for these non-existent bars, where would this result be plotted on the chart? Formulas' plotted indicators can only be plotted on valid bars with data. There would need to be a corresponding empty bar to show the null returns.

            One option you may want to consider, is turning on the white space in your chart (Chart Options --> View --> Whitespace). It doesn't change the indicator calculation, but it will show the gaps. A line plot across such gaps will simply connect the line to the returned values on either end of the gap. Hope this helps.

            Jason K.
            Project Manager
            eSignal - an Interactive Data company

            EFS KnowledgeBase
            JavaScript for EFS Video Series
            EFS Beginner Tutorial Series
            EFS Glossary
            Custom EFS Development Policy

            New User Orientation

            Comment


            • #7
              Jason, thanks, but, this is not to do with gaps in the eSignal data, it is simply an indicator design issue - it is designed not to return a value under certain conditions; I don't see that as unreasonable, non-linear true, but so are markets.

              But obviously as eSignal can't plot dependent series I shall have to change it to return a placeholder to avoid the time shift.

              Comment

              Working...
              X