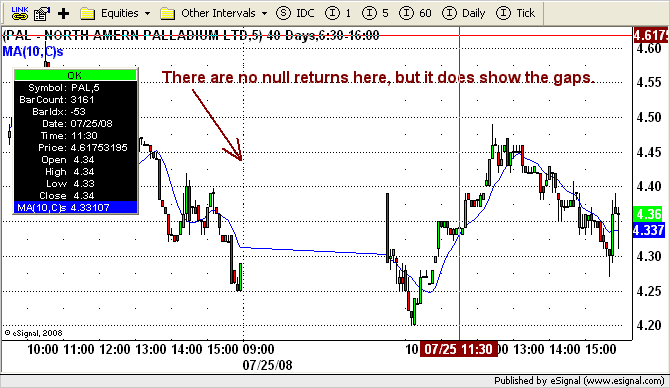
PHP Code:
// 10.1.1057

// If an efsInternal series returns some data and then starts to return nuls, the

// plot of an sma of earlier data is offset forwards in time to "eliminate" the gap.

// Plotting the data (rather than the sma()) shows the expected gap.

//

// This situation occurs when processing "sparse" data.

//

// ema() also fails, presumably this is a general "series of a series" bug?


function preMain() {

    setCursorLabelName("close()",0);

    setDefaultBarFgColor(Color.blue,0);

    setCursorLabelName("sma(close(),2)",1);

    setDefaultBarFgColor(Color.aqua,1);

    setCursorLabelName("close()WithNulls",2);

    setDefaultBarFgColor(Color.purple,2);

    setCursorLabelName("sma(close()WithNulls",3);

    setDefaultBarFgColor(Color.red,3);

}

function main() {


var s1 = efsInternal("closeWithDayofNuls"); // returns close(0), but on previous day returns null


// return (with multipliers to make them visible):

//   the close(),

//   the sma() of the close(),

//   the close() with the day's nulls, and

//   the sma() of that series with the nulls

// expect the smas to be in phase with one having a "gap" where price also has a "gap"


// This is best plotted on a fixed day count  time template (3 to 5 days).


// See that the sma of the "gap" does not start at the left like all the other lines, as it appears that the gap

// has been joined up and the line aligned to the right.

// So the data to the left of the gap is wrong.


return new Array(close(0), 0.9 * sma(2,close(0)), 0.8 * s1, 0.7 * sma(2,s1));

}


function closeWithDayofNuls() {

    var d = new Date();

    if (day(0) == (d.getDate() - 1) )

        return null; // for previous day return null, so expect to see a gap in the plot for that day


    return close(0);


}

Comment