 Tweet
Tweet
Hello to all,
I am a new member to the forums and would greatly appreciate some help from the community with my EFS study. Thank you very much in advance for any help you may be able to offer.
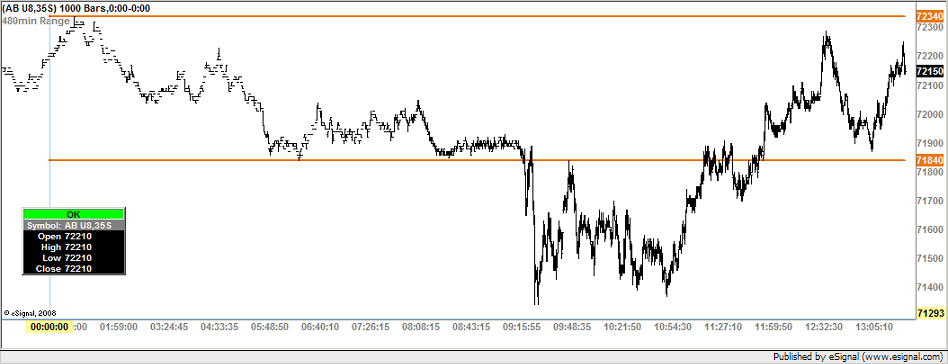
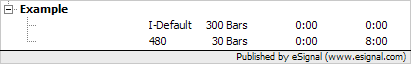
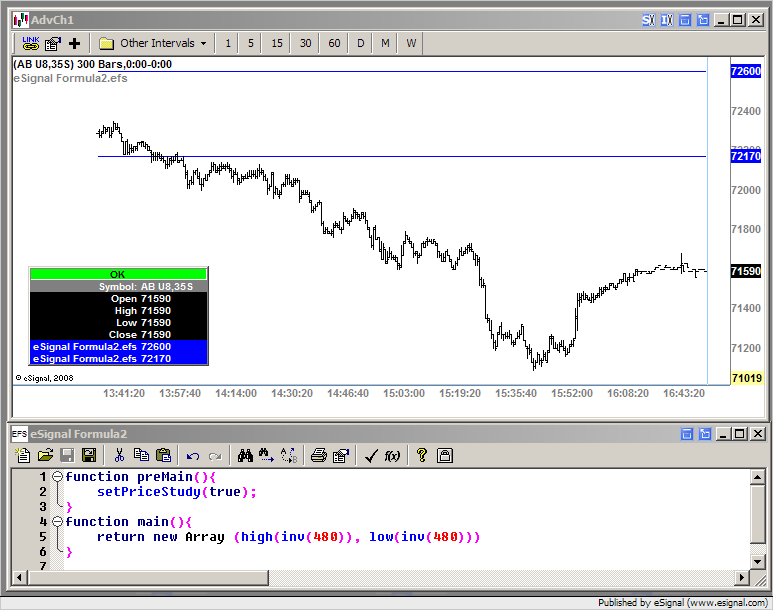
I consider the time period from midnight to 8:00am EST to be night trading. I have written an EFS study that is supposed to get the high and the low value of the 480min bar (i.e. midnight to 8am bar) and plot the 480 min high and low values on charts of lower time frames; for example, 3 min chart. The code is included below. I have two problems with the code that I do not understand and would greatly appreciate any help that I can get from the forum community. Thank you very much.
Problems:
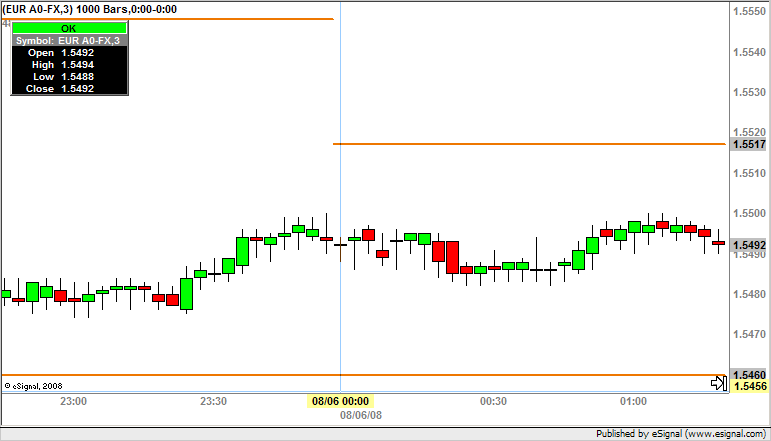
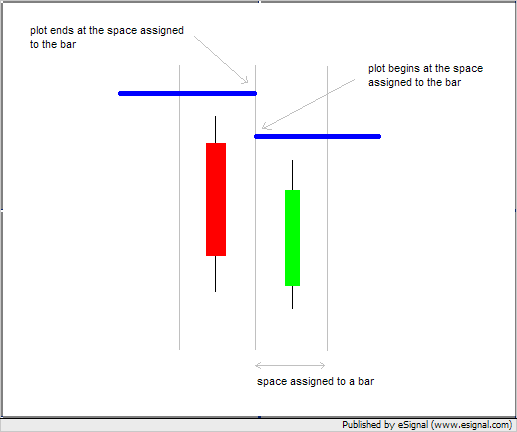
1. The code plots on minute charts but, the lines begin slightly BEFORE midnight and end slightly BEFORE midnight. Why can't I get the lines to align correctly on my 3 min chart?
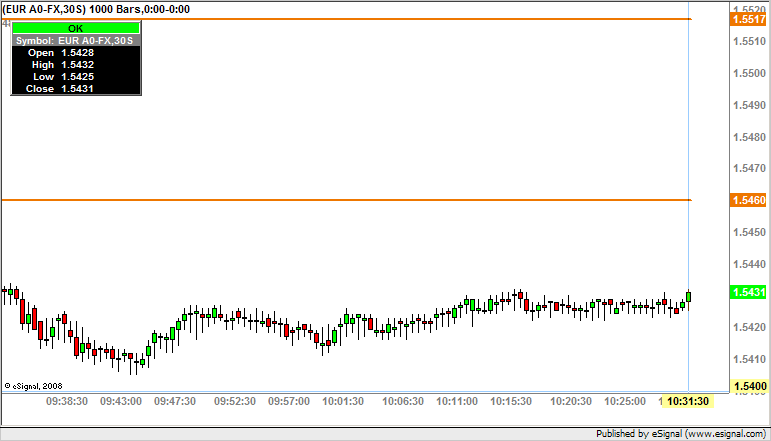
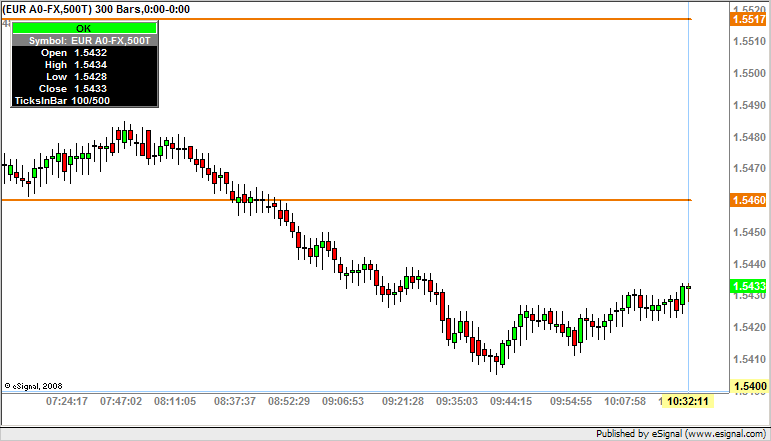
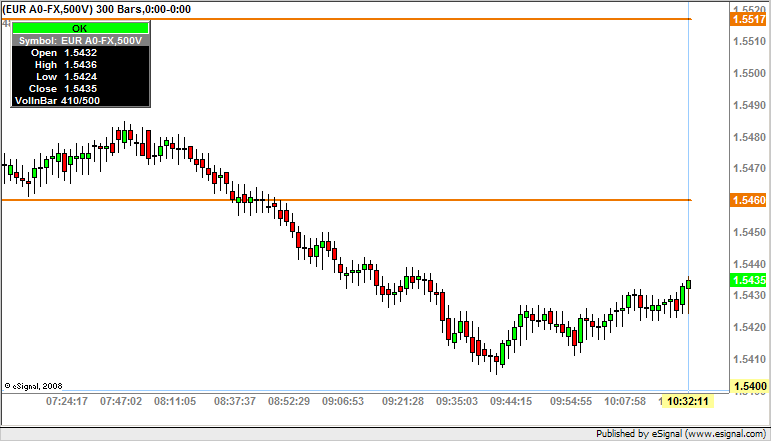
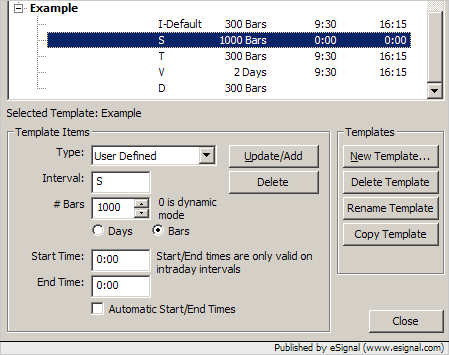
2. The study gives no syntax error but does not plot on a 30 second chart, on a tick chart or on a volume chart. Why?
Regards,
jg
Here is the code:
//480min hi/low study
function preMain() {
setPriceStudy(true);
setStudyTitle("480min Range");
setShowTitleParameters(false);
setCursorLabelName("480min HighRange", 0);
setDefaultBarFgColor(Color.RGB(238,119,0), 0);
setDefaultBarThickness(2, 0);
setPlotType(PLOTTYPE_FLATLINES, 0);
setShowCursorLabel(false, 0);
setCursorLabelName("480min LowRange", 1);
setDefaultBarFgColor(Color.RGB(238,119,0), 1);
setDefaultBarThickness(2, 1);
setPlotType(PLOTTYPE_FLATLINES, 1);
setShowCursorLabel(false, 1);
}
var vHigh = null;
var vLow = null;
var barHigh = null;
var barLow = null;
var barStartTime = 0;
var timeInterval = 480;
function main() {
if (vHigh == null) vHigh = efsInternal("getHigh",barStartTime, timeInterval);
if (vLow == null) vLow = efsInternal("getLow",barStartTime, timeInterval);
var nHigh = null;
nHigh = vHigh.getValue(0);
if (nHigh == null) {
nHigh = barHigh;
}
else {
barHigh = nHigh;
}
var nLow = null;
nLow = vLow.getValue(0);
if (nLow == null) {
nLow = barLow;
}
else {
barLow = nLow;
}
return new Array(nHigh, nLow);
}
/*************************************************
SUPPORT FUNCTIONS
**************************************************/
//== getHigh function returns the high value of a specific bar in a specific time interval
function getHigh(barStartTime, timeInterval) {
var h = null;
var barTime = hour(0, inv(timeInterval))*100 + minute(0, inv(timeInterval));
if (barTime == barStartTime) h = high(0, inv(timeInterval));
return h;
}
//== getLow function returns the low value of a specif bar in a specific time interval
function getLow(barStartTime, timeInterval) {
var l = null;
var barTime = hour(0, inv(timeInterval))*100 + minute(0, inv(timeInterval));
if (barTime == barStartTime) l = low(0, inv(timeInterval));
return l;
}
I am a new member to the forums and would greatly appreciate some help from the community with my EFS study. Thank you very much in advance for any help you may be able to offer.
I consider the time period from midnight to 8:00am EST to be night trading. I have written an EFS study that is supposed to get the high and the low value of the 480min bar (i.e. midnight to 8am bar) and plot the 480 min high and low values on charts of lower time frames; for example, 3 min chart. The code is included below. I have two problems with the code that I do not understand and would greatly appreciate any help that I can get from the forum community. Thank you very much.
Problems:
1. The code plots on minute charts but, the lines begin slightly BEFORE midnight and end slightly BEFORE midnight. Why can't I get the lines to align correctly on my 3 min chart?
2. The study gives no syntax error but does not plot on a 30 second chart, on a tick chart or on a volume chart. Why?
Regards,
jg
Here is the code:
//480min hi/low study
function preMain() {
setPriceStudy(true);
setStudyTitle("480min Range");
setShowTitleParameters(false);
setCursorLabelName("480min HighRange", 0);
setDefaultBarFgColor(Color.RGB(238,119,0), 0);
setDefaultBarThickness(2, 0);
setPlotType(PLOTTYPE_FLATLINES, 0);
setShowCursorLabel(false, 0);
setCursorLabelName("480min LowRange", 1);
setDefaultBarFgColor(Color.RGB(238,119,0), 1);
setDefaultBarThickness(2, 1);
setPlotType(PLOTTYPE_FLATLINES, 1);
setShowCursorLabel(false, 1);
}
var vHigh = null;
var vLow = null;
var barHigh = null;
var barLow = null;
var barStartTime = 0;
var timeInterval = 480;
function main() {
if (vHigh == null) vHigh = efsInternal("getHigh",barStartTime, timeInterval);
if (vLow == null) vLow = efsInternal("getLow",barStartTime, timeInterval);
var nHigh = null;
nHigh = vHigh.getValue(0);
if (nHigh == null) {
nHigh = barHigh;
}
else {
barHigh = nHigh;
}
var nLow = null;
nLow = vLow.getValue(0);
if (nLow == null) {
nLow = barLow;
}
else {
barLow = nLow;
}
return new Array(nHigh, nLow);
}
/*************************************************
SUPPORT FUNCTIONS
**************************************************/
//== getHigh function returns the high value of a specific bar in a specific time interval
function getHigh(barStartTime, timeInterval) {
var h = null;
var barTime = hour(0, inv(timeInterval))*100 + minute(0, inv(timeInterval));
if (barTime == barStartTime) h = high(0, inv(timeInterval));
return h;
}
//== getLow function returns the low value of a specif bar in a specific time interval
function getLow(barStartTime, timeInterval) {
var l = null;
var barTime = hour(0, inv(timeInterval))*100 + minute(0, inv(timeInterval));
if (barTime == barStartTime) l = low(0, inv(timeInterval));
return l;
}
Comment