Announcement

Collapse
No announcement yet.

Plotting Problem

Collapse
This topic is closed.
X
X
 
  • Filter
  • Time
  • Show
Clear All
new posts

  • Plotting Problem

    Hello to all,

    I am a new member to the forums and would greatly appreciate some help from the community with my EFS study. Thank you very much in advance for any help you may be able to offer.

    I consider the time period from midnight to 8:00am EST to be night trading. I have written an EFS study that is supposed to get the high and the low value of the 480min bar (i.e. midnight to 8am bar) and plot the 480 min high and low values on charts of lower time frames; for example, 3 min chart. The code is included below. I have two problems with the code that I do not understand and would greatly appreciate any help that I can get from the forum community. Thank you very much.

    Problems:
    1. The code plots on minute charts but, the lines begin slightly BEFORE midnight and end slightly BEFORE midnight. Why can't I get the lines to align correctly on my 3 min chart?

    2. The study gives no syntax error but does not plot on a 30 second chart, on a tick chart or on a volume chart. Why?

    Regards,
    jg

    Here is the code:

    //480min hi/low study

    function preMain() {
    setPriceStudy(true);
    setStudyTitle("480min Range");
    setShowTitleParameters(false);

    setCursorLabelName("480min HighRange", 0);
    setDefaultBarFgColor(Color.RGB(238,119,0), 0);
    setDefaultBarThickness(2, 0);
    setPlotType(PLOTTYPE_FLATLINES, 0);
    setShowCursorLabel(false, 0);
    setCursorLabelName("480min LowRange", 1);
    setDefaultBarFgColor(Color.RGB(238,119,0), 1);
    setDefaultBarThickness(2, 1);
    setPlotType(PLOTTYPE_FLATLINES, 1);
    setShowCursorLabel(false, 1);
    }

    var vHigh = null;
    var vLow = null;
    var barHigh = null;
    var barLow = null;
    var barStartTime = 0;
    var timeInterval = 480;

    function main() {
    if (vHigh == null) vHigh = efsInternal("getHigh",barStartTime, timeInterval);
    if (vLow == null) vLow = efsInternal("getLow",barStartTime, timeInterval);

    var nHigh = null;
    nHigh = vHigh.getValue(0);
    if (nHigh == null) {
    nHigh = barHigh;
    }
    else {
    barHigh = nHigh;
    }

    var nLow = null;
    nLow = vLow.getValue(0);
    if (nLow == null) {
    nLow = barLow;
    }
    else {
    barLow = nLow;
    }
    return new Array(nHigh, nLow);
    }

    /*************************************************
    SUPPORT FUNCTIONS
    **************************************************/

    //== getHigh function returns the high value of a specific bar in a specific time interval
    function getHigh(barStartTime, timeInterval) {
    var h = null;
    var barTime = hour(0, inv(timeInterval))*100 + minute(0, inv(timeInterval));
    if (barTime == barStartTime) h = high(0, inv(timeInterval));
    return h;
    }

    //== getLow function returns the low value of a specif bar in a specific time interval
    function getLow(barStartTime, timeInterval) {
    var l = null;
    var barTime = hour(0, inv(timeInterval))*100 + minute(0, inv(timeInterval));
    if (barTime == barStartTime) l = low(0, inv(timeInterval));
    return l;
    }
  • #2
    Re: Plotting Problem

    jg

    1. The code plots on minute charts but, the lines begin slightly BEFORE midnight and end slightly BEFORE midnight. Why can't I get the lines to align correctly on my 3 min chart?
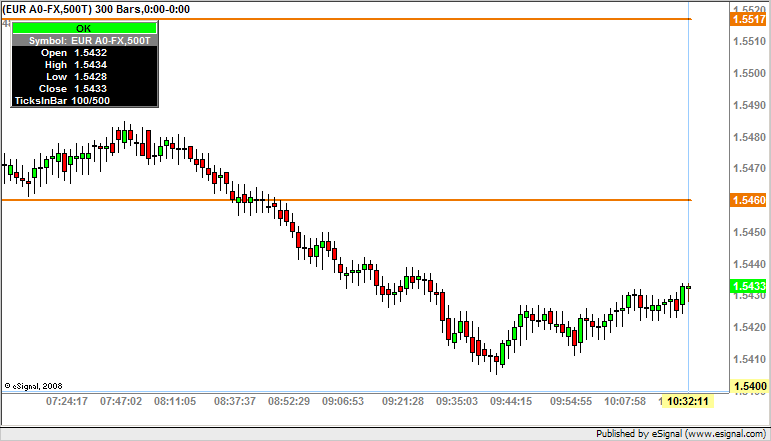
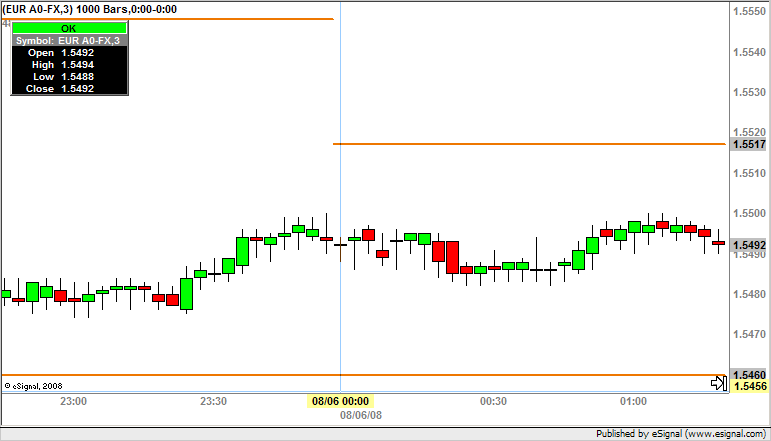
    As far as I can see the plots begin on the midnight bar and end on the bar before it (see enclosed screenshot)
    If this is not happening at your end you may want to post an image [in which it is clearly shown what symbol, interval, time template settings etc] that illustrates the issue


    2. The study gives no syntax error but does not plot on a 30 second chart, on a tick chart or on a volume chart. Why?
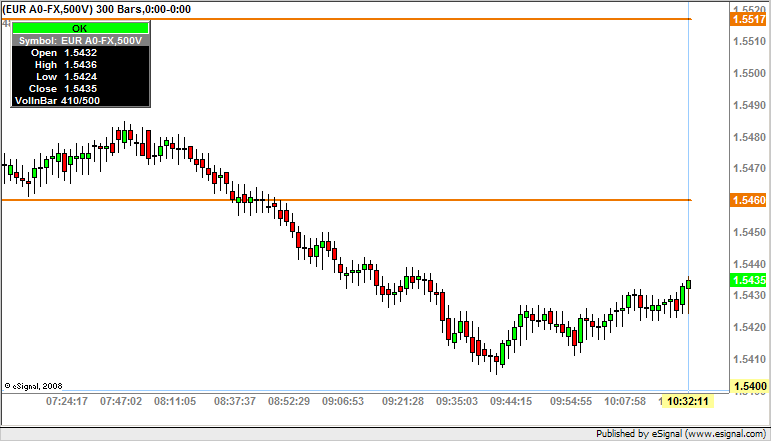
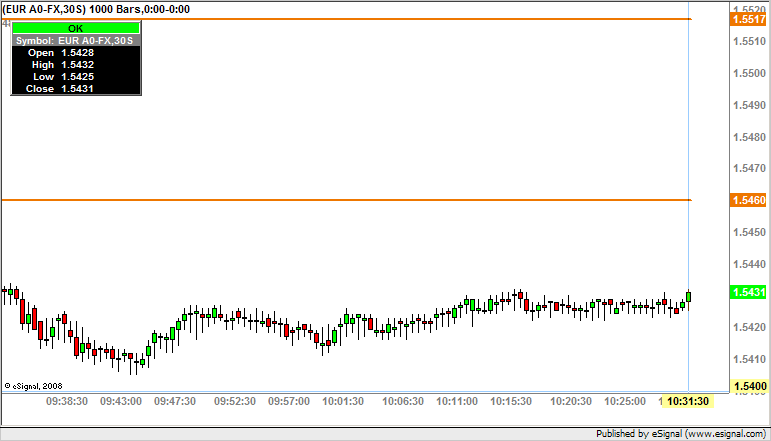
    Again it seems to be working fine at my end on all the interval types you mentioned (see following screenshots)


    On a different note you could simplify your formula by calculating both the High and the Low in the same function and then call that function using one efsInternal() call only. For an example of this see the hilo_firstxminutes2.efs which I posted here
    Alex


    Originally posted by jg
    Hello to all,

    I am a new member to the forums and would greatly appreciate some help from the community with my EFS study. Thank you very much in advance for any help you may be able to offer.

    I consider the time period from midnight to 8:00am EST to be night trading. I have written an EFS study that is supposed to get the high and the low value of the 480min bar (i.e. midnight to 8am bar) and plot the 480 min high and low values on charts of lower time frames; for example, 3 min chart. The code is included below. I have two problems with the code that I do not understand and would greatly appreciate any help that I can get from the forum community. Thank you very much.

    Problems:
    1. The code plots on minute charts but, the lines begin slightly BEFORE midnight and end slightly BEFORE midnight. Why can't I get the lines to align correctly on my 3 min chart?

    2. The study gives no syntax error but does not plot on a 30 second chart, on a tick chart or on a volume chart. Why?

    Regards,
    jg

    Here is the code:

    //480min hi/low study

    function preMain() {
    setPriceStudy(true);
    setStudyTitle("480min Range");
    setShowTitleParameters(false);

    setCursorLabelName("480min HighRange", 0);
    setDefaultBarFgColor(Color.RGB(238,119,0), 0);
    setDefaultBarThickness(2, 0);
    setPlotType(PLOTTYPE_FLATLINES, 0);
    setShowCursorLabel(false, 0);
    setCursorLabelName("480min LowRange", 1);
    setDefaultBarFgColor(Color.RGB(238,119,0), 1);
    setDefaultBarThickness(2, 1);
    setPlotType(PLOTTYPE_FLATLINES, 1);
    setShowCursorLabel(false, 1);
    }

    var vHigh = null;
    var vLow = null;
    var barHigh = null;
    var barLow = null;
    var barStartTime = 0;
    var timeInterval = 480;

    function main() {
    if (vHigh == null) vHigh = efsInternal("getHigh",barStartTime, timeInterval);
    if (vLow == null) vLow = efsInternal("getLow",barStartTime, timeInterval);

    var nHigh = null;
    nHigh = vHigh.getValue(0);
    if (nHigh == null) {
    nHigh = barHigh;
    }
    else {
    barHigh = nHigh;
    }

    var nLow = null;
    nLow = vLow.getValue(0);
    if (nLow == null) {
    nLow = barLow;
    }
    else {
    barLow = nLow;
    }
    return new Array(nHigh, nLow);
    }

    /*************************************************
    SUPPORT FUNCTIONS
    **************************************************/

    //== getHigh function returns the high value of a specific bar in a specific time interval
    function getHigh(barStartTime, timeInterval) {
    var h = null;
    var barTime = hour(0, inv(timeInterval))*100 + minute(0, inv(timeInterval));
    if (barTime == barStartTime) h = high(0, inv(timeInterval));
    return h;
    }

    //== getLow function returns the low value of a specif bar in a specific time interval
    function getLow(barStartTime, timeInterval) {
    var l = null;
    var barTime = hour(0, inv(timeInterval))*100 + minute(0, inv(timeInterval));
    if (barTime == barStartTime) l = low(0, inv(timeInterval));
    return l;
    }
    Comment


    • #3
      Hi Alexis,

      Thank you for your reply to my post and to your helpful remarks. I guess I am still somewhat confused.

      Regarding item #1:
      In the first chart you show (EUR A0-FX,3) the blue vertical line defines midnight. What I see on your chart is that the horizontal orange lines begin and end BEFORE the vertical blue line. This happens on my charts as well. Shouldn't the horizontal orange lines begin and end on the blue vertical line? I am sure that this reflects my lack of knowledge so please forgive me for being obtuse.

      Regarding item#2:
      Your charts (tick and second) show the orange horizontal lines plotting but my charts do not. I am not sure why. Specifically, I am using the symbol AB U8 (Russell 2000 Emini Futures) and the time interval is 35 seconds. No lines plot. My apologies but I am still confused. Please explain.

      Finally, thank you very much for your suggestion regarding the hilo using a single call to efsInternal(). I will look at your post and modify my code accordingly. Thank you.

      In writing this reply, one more question came to me that I would like to ask if I may: "Is this code executing on every tick of each bar?" If yes, would it be more computationally efficient if I added the getBarState() == BARSTATE_NEWBAR condition into the code? I believe this will force the code to execute only when a new bar comes in and therefore will be more efficient. Am I correct? Please advise.

      Alexis, thank you very much for taking the time to reply to my post (and questions) and for all your prompt help. It is very much appreciated.

      Best regards,
      jg

      Comment


      • #4
        jg

        In the first chart you show (EUR A0-FX,3) the blue vertical line defines midnight. What I see on your chart is that the horizontal orange lines begin and end BEFORE the vertical blue line. This happens on my charts as well. Shouldn't the horizontal orange lines begin and end on the blue vertical line? I am sure that this reflects my lack of knowledge so please forgive me for being obtuse.
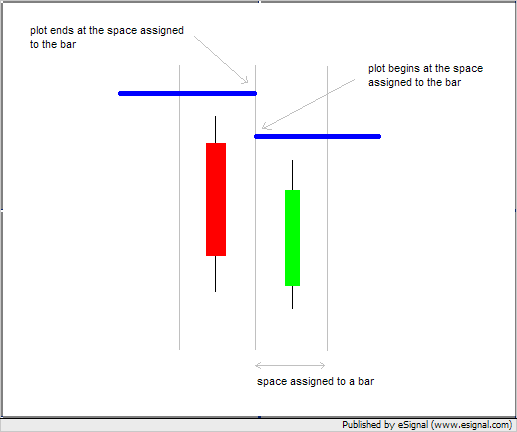
        I see what you are referring to. That is just a function of how some plots are displayed in eSignal ie they start at the leftmost point of the space assigned to a bar and end at the rightmost point of the space assigned to a bar.
        The graphic enclosed below should illustrate how it works


        Your charts (tick and second) show the orange horizontal lines plotting but my charts do not. I am not sure why. Specifically, I am using the symbol AB U8 (Russell 2000 Emini Futures) and the time interval is 35 seconds. No lines plot. My apologies but I am still confused. Please explain.
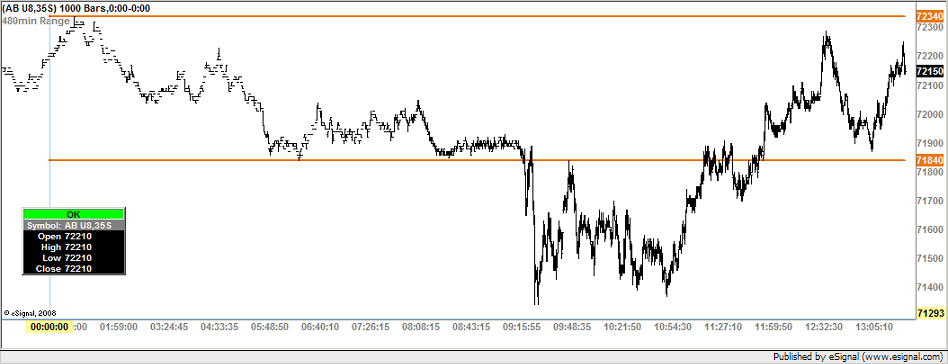
        I tried using the same symbol and interval you indicated and as far as I can see the formula is plotting without any problems.


        It is possible that you may not have enough seconds bars plotted on your chart for the efs engine to be able to synchronize the plots based on the code logic used in your script which is looking for specific bar times. If you do not have an S user defined interval in the Time Template the chart will load 300 bars by default which may not be sufficient. If that is the case create a new User Defined Interval setting it to S as the Interval and [for example] 1000 as the #Bars bars to load (as used in my screenshot).
        As I suggested in my previous reply you may need to post some images for me or someone at eSignal to try and replicate the problem you are having.
        As to your last question the script is executing on every tick and you could modify so that it executes only at BARSTATE_NEWBAR. For that matter past 8 am you don't even need the script to execute any further since those values no longer need to be calcuated
        Alex


        Originally posted by jg
        Hi Alexis,

        Thank you for your reply to my post and to your helpful remarks. I guess I am still somewhat confused.

        Regarding item #1:
        In the first chart you show (EUR A0-FX,3) the blue vertical line defines midnight. What I see on your chart is that the horizontal orange lines begin and end BEFORE the vertical blue line. This happens on my charts as well. Shouldn't the horizontal orange lines begin and end on the blue vertical line? I am sure that this reflects my lack of knowledge so please forgive me for being obtuse.

        Regarding item#2:
        Your charts (tick and second) show the orange horizontal lines plotting but my charts do not. I am not sure why. Specifically, I am using the symbol AB U8 (Russell 2000 Emini Futures) and the time interval is 35 seconds. No lines plot. My apologies but I am still confused. Please explain.

        Finally, thank you very much for your suggestion regarding the hilo using a single call to efsInternal(). I will look at your post and modify my code accordingly. Thank you.

        In writing this reply, one more question came to me that I would like to ask if I may: "Is this code executing on every tick of each bar?" If yes, would it be more computationally efficient if I added the getBarState() == BARSTATE_NEWBAR condition into the code? I believe this will force the code to execute only when a new bar comes in and therefore will be more efficient. Am I correct? Please advise.

        Alexis, thank you very much for taking the time to reply to my post (and questions) and for all your prompt help. It is very much appreciated.

        Best regards,
        jg

        Comment


        • #5
          Hi Alex,

          Thank you very much for your prompt reply to my questions. I do appreciate it very much.

          Regarding the drawing of lines to the end of, and from the start of, the space assigned to each bar, I understand now. It is clear and I understand how the functions plot. Thank you for clarifying that for me.

          Regarding plotting on the 35 second chart, you state in your reply,

          "... create a new User Defined Interval setting it to S ..."

          I have two questions:
          1. Is there any way to determine, from within the study whether you have enough bars for the study to plot? If yes, how would one go about it?
          2. I am not sure how to create a new User Defined Interval setting inside my study. Can you please show me how that could be done, or point me somewhere where I could learn how to do it? Thank you very much.

          Finally, you state:
          "As to your last question the script is executing on every tick and you could modify so that it executes only at BARSTATE_NEWBAR. For that matter past 8 am you don't even need the script to execute any further since those values no longer need to be calcuated."

          I had not thought of that and it is a great suggestion. I guess I would need to stop calculating the high and low at 8 am and plot the lines only on the start of each new bar. I know how to plot the bars only on each new bar, but I am not exactly sure how to modify the code so that it stops computing the high and low values after 8 am.Can you please suggest a way to achieve that? Thank you very much for all your help.
          Regards,
          Jane

          Comment


          • #6
            Jane

            1. Is there any way to determine, from within the study whether you have enough bars for the study to plot? If yes, how would one go about it?
            You would need to write a conditional statement that checks if the chart contains a defined number of bars and if that evaluates to false you could then display a message on the chart eg
            PHP Code:
            if(getNumBars()<1000) {
                
            //insert here the command to display your text on the chart 

            2. I am not sure how to create a new User Defined Interval setting inside my study. Can you please show me how that could be done, or point me somewhere where I could learn how to do it? Thank you very much.
            You would not do that inside the study but using a Time Template. For the instructions on how to set up and use Time Template see this article in the eSignal KnowledgeBase. See also the enclosed example of a Time Template


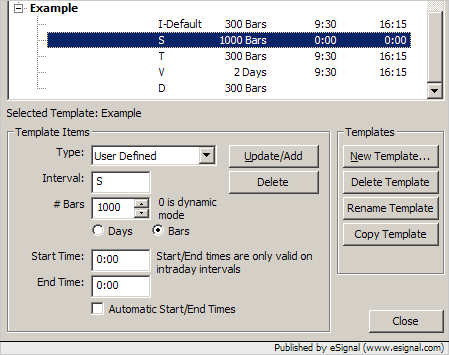
            In the example I set the Intraday Default to load 300 bars starting from 9:30 and ending at 16:15 This definition would be applied to any minute based interval that is not specifically defined in the Time Template
            Then I created a User Defined entry for the seconds-bar by setting the Interval to S and the #Bars to 1000 with a Start/End time of 00:00/00:00 (you can also use 00:00/24:00 which is the same). The other User Defined intervals are for T (tick bars), V (volume-bars) and D (daily) each with a different set of parameters
            Alex


            Originally posted by jg
            Hi Alex,

            Thank you very much for your prompt reply to my questions. I do appreciate it very much.

            Regarding the drawing of lines to the end of, and from the start of, the space assigned to each bar, I understand now. It is clear and I understand how the functions plot. Thank you for clarifying that for me.

            Regarding plotting on the 35 second chart, you state in your reply,

            "... create a new User Defined Interval setting it to S ..."

            I have two questions:
            1. Is there any way to determine, from within the study whether you have enough bars for the study to plot? If yes, how would one go about it?
            2. I am not sure how to create a new User Defined Interval setting inside my study. Can you please show me how that could be done, or point me somewhere where I could learn how to do it? Thank you very much.

            Finally, you state:
            "As to your last question the script is executing on every tick and you could modify so that it executes only at BARSTATE_NEWBAR. For that matter past 8 am you don't even need the script to execute any further since those values no longer need to be calcuated."

            I had not thought of that and it is a great suggestion. I guess I would need to stop calculating the high and low at 8 am and plot the lines only on the start of each new bar. I know how to plot the bars only on each new bar, but I am not exactly sure how to modify the code so that it stops computing the high and low values after 8 am.Can you please suggest a way to achieve that? Thank you very much for all your help.
            Regards,
            Jane

            Comment


            • #7
              Hi Alex,

              Your replies have been extremely helpful and I have learned much from the insight you provided. Thank you very much.

              Regarding item#1, determining how many bars are needed before a study plots, I understand your suggestion but I was looking for something else. I was wondering if there is a way to calculate this. Clearly there must be way for the system to determine whether to plot or not in the chart and I wondered what the formula or check (before an EFS study plots) is in the chart. In other words, how does the chart know whether it can plot the study or not?
              Regards,
              Jane

              Comment


              • #8
                Jane
                Assuming I correctly understood what you are asking there isn't [to my knowledge] a specific function that will do what you want. You will need to code the necessary checks using conditional statements based on the code logic and the requirements of your script [such as for example if(myValue==null) return;]
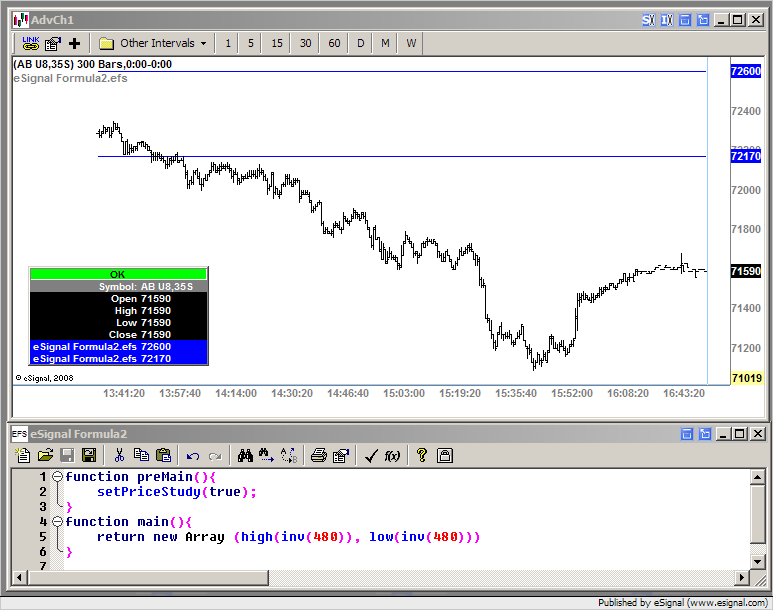
                Anyhow I think you are implementing a rather complex solution for what is IMHO a relatively simple problem. I would suggest again that you review the formula I indicated in a previous reply as I believe that will accomplish in a more efficient and effective way what you are trying to do. For that matter in your case you could simplify the efs even further with the use of a Time Template such as the following one


                In its most basic form the efs could in fact be reduced to the one shown in the screenshot enclosed below
                Alex


                Originally posted by jg
                Hi Alex,

                Your replies have been extremely helpful and I have learned much from the insight you provided. Thank you very much.

                Regarding item#1, determining how many bars are needed before a study plots, I understand your suggestion but I was looking for something else. I was wondering if there is a way to calculate this. Clearly there must be way for the system to determine whether to plot or not in the chart and I wondered what the formula or check (before an EFS study plots) is in the chart. In other words, how does the chart know whether it can plot the study or not?
                Regards,
                Jane

                Comment


                • #9
                  Hi Alex,

                  Thank you very much for you reply and insight. I apologize for the delay in my response - I was away.

                  Regarding the code you wrote, vow. It is very simple and does the job effectively. The only concern I have is that it will execute on every 480 min bar and I want it to plot the high and low values of only the first 480 min bar of the day. Using your info posted I have therefore change the study as follows:

                  /*
                  480 min Range
                  ************************************************** ************************************************** ***********************/

                  function preMain() {
                  setPriceStudy(true);
                  setStudyTitle("480min Range");
                  setShowTitleParameters(false);

                  setCursorLabelName("480min HighRange", 0);
                  setDefaultBarFgColor(Color.RGB(238,119,0), 0);
                  setDefaultBarThickness(2, 0);
                  setPlotType(PLOTTYPE_FLATLINES, 0);
                  setShowCursorLabel(false, 0);

                  setCursorLabelName("480min LowRange", 1);
                  setDefaultBarFgColor(Color.RGB(238,119,0), 1);
                  setDefaultBarThickness(2, 1);
                  setPlotType(PLOTTYPE_FLATLINES, 1);
                  setShowCursorLabel(false, 1);
                  }

                  var vHigh = null;
                  var vLow = null;
                  var barStartTime = 0;
                  var timeInterval = 480;

                  function main() {
                  var barTime = hour(0, inv(timeInterval))*100 + minute(0, inv(timeInterval));
                  if (barTime >= 0 && barTime <= 800) {
                  vHigh = high(inv(timeInterval));
                  vLow = low(inv(timeInterval));
                  }
                  return new Array(vHigh, vLow);
                  }

                  I think that this code will determine the high and low values only between midnight and 8am and will continue to plot those for the rest of the day. I hope this is correct.

                  As an aside, when I changed the barTime line above to:

                  var barTime = hour(0, inv(timeInterval))*100 + minute(0, inv(timeInterval)) + second(0, inv(timeInterval));

                  it made no difference. Can you please tell me why? Thank you very much.

                  Regards,
                  Jane

                  Comment


                  • #10
                    Jane

                    The only concern I have is that it will execute on every 480 min bar and I want it to plot the high and low values of only the first 480 min bar of the day.
                    If you set up the Time Template as I showed you in my previous reply there will be only one 480 min bar per day
                    You can verify this by plotting a 480 min chart in which you are using that same Time Template

                    As an aside, when I changed the barTime line above to:
                    var barTime = hour(0, inv(timeInterval))*100 + minute(0, inv(timeInterval)) + second(0, inv(timeInterval));
                    it made no difference. Can you please tell me why?
                    Because in minute bars (which is what you are referencing) the seconds value of the bar's time stamp is always 0 so the condition evaluates to true with either syntax
                    Alex


                    Originally posted by jg
                    Hi Alex,

                    Thank you very much for you reply and insight. I apologize for the delay in my response - I was away.

                    Regarding the code you wrote, vow. It is very simple and does the job effectively. The only concern I have is that it will execute on every 480 min bar and I want it to plot the high and low values of only the first 480 min bar of the day. Using your info posted I have therefore change the study as follows:

                    /*
                    480 min Range
                    ************************************************** ************************************************** ***********************/

                    function preMain() {
                    setPriceStudy(true);
                    setStudyTitle("480min Range");
                    setShowTitleParameters(false);

                    setCursorLabelName("480min HighRange", 0);
                    setDefaultBarFgColor(Color.RGB(238,119,0), 0);
                    setDefaultBarThickness(2, 0);
                    setPlotType(PLOTTYPE_FLATLINES, 0);
                    setShowCursorLabel(false, 0);

                    setCursorLabelName("480min LowRange", 1);
                    setDefaultBarFgColor(Color.RGB(238,119,0), 1);
                    setDefaultBarThickness(2, 1);
                    setPlotType(PLOTTYPE_FLATLINES, 1);
                    setShowCursorLabel(false, 1);
                    }

                    var vHigh = null;
                    var vLow = null;
                    var barStartTime = 0;
                    var timeInterval = 480;

                    function main() {
                    var barTime = hour(0, inv(timeInterval))*100 + minute(0, inv(timeInterval));
                    if (barTime >= 0 && barTime <= 800) {
                    vHigh = high(inv(timeInterval));
                    vLow = low(inv(timeInterval));
                    }
                    return new Array(vHigh, vLow);
                    }

                    I think that this code will determine the high and low values only between midnight and 8am and will continue to plot those for the rest of the day. I hope this is correct.

                    As an aside, when I changed the barTime line above to:

                    var barTime = hour(0, inv(timeInterval))*100 + minute(0, inv(timeInterval)) + second(0, inv(timeInterval));

                    it made no difference. Can you please tell me why? Thank you very much.

                    Regards,
                    Jane

                    Comment


                    • #11
                      Hi Alex,

                      Thank you very much for all your help. I now understand the seconds value of the bar's time stamp and why the line of code did not work.

                      Regarding the time template approach you provided below, I understand what you have done. What I see is that you specified a time template for 480 min bars that "plots" 30, 0:00 to 8:00 am bars - one the first 480 min bar of each day for the last 30 days. Since only the first bars are "plotted", then the simple and very efficient code you provided works great.

                      But if you actually wanted a 480 min bar chart in which all the 480 min bars were plotted then this would not work since it would conflict with the time template.

                      I actually have (and use) a 480 min bar chart so how do I get the template approach to work? Will the revised code posted work efficiently?

                      Many thanks for your patience and great help Alex. Thank you very much.

                      Regards,
                      Jane

                      Comment


                      • #12
                        Jane

                        But if you actually wanted a 480 min bar chart in which all the 480 min bars were plotted then this would not work since it would conflict with the time template.
                        I actually have (and use) a 480 min bar chart so how do I get the template approach to work?
                        In that case you may want to consider using the formula I suggested in my initial reply which is also more flexible as it allows to set the start and end times and use any external interval
                        At this point I believe you should have sufficient information and examples available to you to modify or enhance your efs to suit your requirements
                        Alex


                        Originally posted by jg
                        Hi Alex,

                        Thank you very much for all your help. I now understand the seconds value of the bar's time stamp and why the line of code did not work.

                        Regarding the time template approach you provided below, I understand what you have done. What I see is that you specified a time template for 480 min bars that "plots" 30, 0:00 to 8:00 am bars - one the first 480 min bar of each day for the last 30 days. Since only the first bars are "plotted", then the simple and very efficient code you provided works great.

                        But if you actually wanted a 480 min bar chart in which all the 480 min bars were plotted then this would not work since it would conflict with the time template.

                        I actually have (and use) a 480 min bar chart so how do I get the template approach to work? Will the revised code posted work efficiently?

                        Many thanks for your patience and great help Alex. Thank you very much.

                        Regards,
                        Jane

                        Comment


                        • #13
                          Hi Alex,

                          I now do have all the information to continue. Thank you very much for all you patient help. It is much appreciated.

                          Regards,
                          Jane

                          Comment


                          • #14
                            Jane
                            You are most welcome
                            Alex


                            Originally posted by jg
                            Hi Alex,

                            I now do have all the information to continue. Thank you very much for all you patient help. It is much appreciated.

                            Regards,
                            Jane

                            Comment

                            Working...
                            X