Hello,
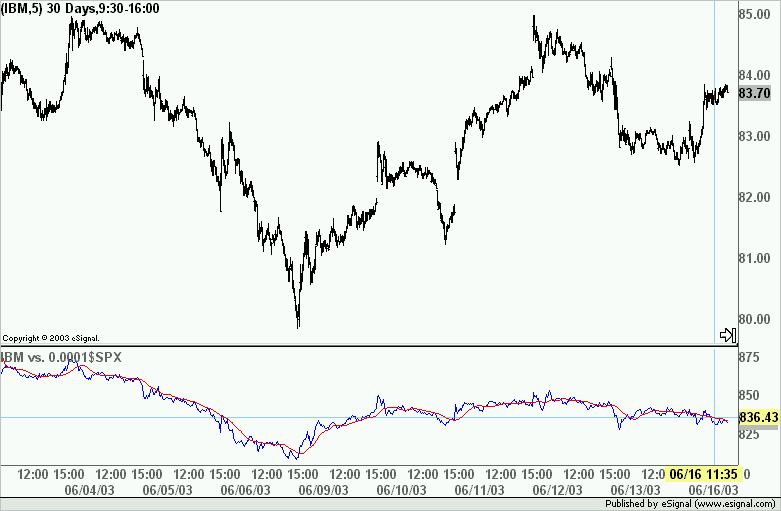
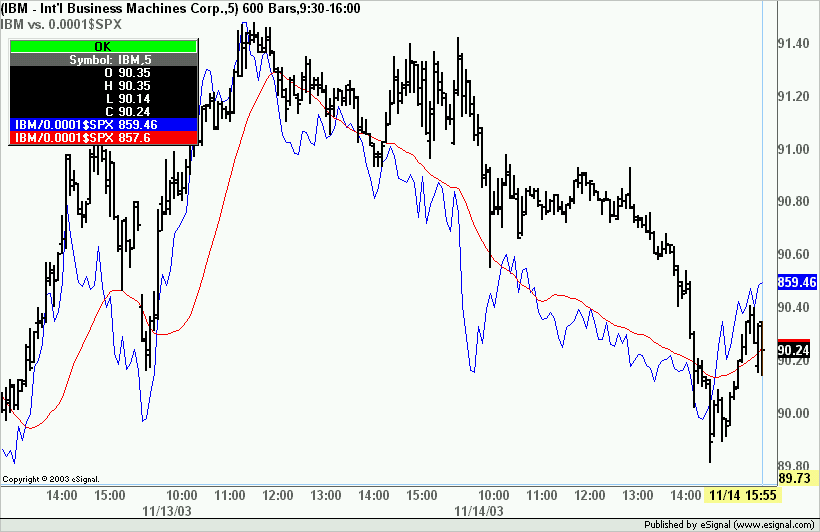
I have been using the attached EFS formula to display the relative strength of a stock when compared to the SPX (the RS indicator). The problem is, when this formula is attached to intraday charts, say a 5 minute chart, the RS line and its moving average only appear on the last four days of data. My other indicators go back several months. Can this be changed?
Your help is appreciated.
Brad


Comment