Announcement

Collapse
No announcement yet.

Please Help - RS study

Collapse
X
 
  • Filter
  • Time
  • Show
Clear All
new posts

  • Please Help - RS study

    Hello,

    I have been using the attached EFS formula to display the relative strength of a stock when compared to the SPX (the RS indicator). The problem is, when this formula is attached to intraday charts, say a 5 minute chart, the RS line and its moving average only appear on the last four days of data. My other indicators go back several months. Can this be changed?

    Your help is appreciated.

    Brad
    Attached Files

  • #2
    If you set up a time template (right click on chart Time Template->Edit) with a intraday default using a fixed number of days, it should work fine for that number of days. My guess is you are using Dynamic right now.
    Garth

    Comment


    • #3
      It appears.....

      As though this problem is related to the pulling of the "$SPX" data. I have looked at the code and played with it, but everything I do to try to pull more $SPX data into this file for comparison results in the same length of the indicator.

      I have tested it, but setting b=11; (line 57), and this results in a complete set of indicator values...

      So, the problem has to be with pulling data for the $SPX. If no data is pulled for a specific bar, then this EFS returns NULL for both the indicator values.

      Maybe it is a limitation of the getValue function, or maybe there is something we can do to try to resolve this. This would be a good question for JasonK. He might be able to offer more assistance.

      Brad
      Brad Matheny
      eSignal Solution Provider since 2000

      Comment


      • #4
        Thanks for your help. Would I just wait for JasonK to reply to this post, or is there some way that I can send the question to him directly? It would be very helpful if i were able to pull up more data.

        Thanks again,

        Brad

        Comment


        • #5
          Try my suggestion first, I have tested it and know it works on my charts.

          If for some reason could can't do this or it doesn't work for you, then we can worry about how the engine handles second symbols.

          Garth
          Garth

          Comment


          • #6
            As Garth correctly points out the issue has to do with the Time Template.
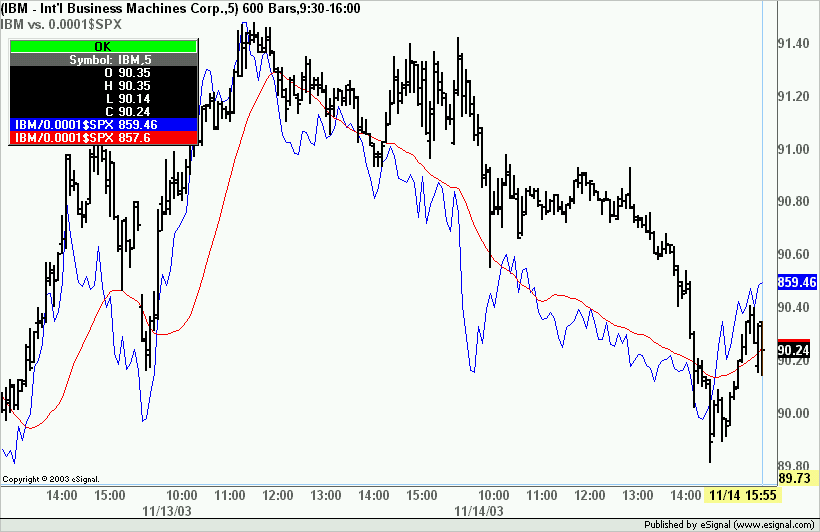
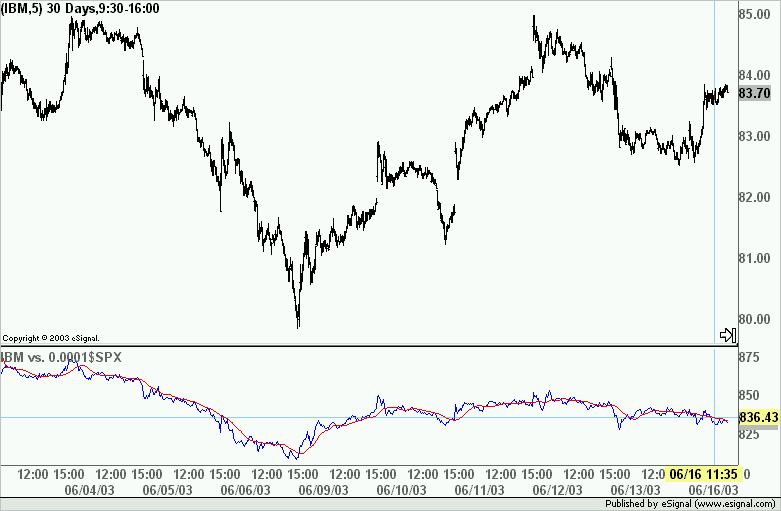
            As you can see in the image below the efs as posted is plotting data from more than 30 days ago on a 5 min chart
            Alex

            Comment


            • #7
              Thanks,

              I run about 50 advanced charts in my layout. I changed the time template from dynamic to 45 days and after about 20 minutes of data loading, eSignal crashes. I tried once again with the same result. I'm assuming this is has to do with the number of charts I have up and that I'm not in 'dynamic' mode. Is it not feasible to run a fixed number of days, say 45, if I have this many charts in my layout? The reason I have so many charts is that I have custom alerts attached to each of them.

              Thanks

              Comment


              • #8
                I don't know of any issues with that many charts, but someone from eSignal would know better. I only run 8-10 per page currently.

                You might try a few things to narrow down the root cause. I would suggest just changing the TT on the charts that are running the study in question for example (unless that is all of the charts). Another idea might be to see what happens if you load only 10 days of data first.

                Are any of these tick charts, or are they all interval?

                Also with 50 charts, if you use a lot of indicators, it will take a long time to load 45 days of info (more so if any are tick charts). But 20 minutes does sound a bit excessive. I have about 10-12 indicators per chart and it doesn't even take 2 minutes for everything to load. So unless you are running a slow system, or using a slow connection to the internet something sounds odd. Do you run a lot of custom EFS code?

                Garth
                Garth

                Comment


                • #9
                  RS on 'price study'?

                  Is there an existing formula, that draws a relative strength ON the price chart?,
                  i.e. A PRICE STUDY RS??.

                  regards and keep up the good work,

                  AB

                  Comment


                  • #10
                    alvinsboy
                    If you are referring to the RS efs attached to an earlier message in this thread you can overlay it on the price pane if you are using version 7.5 (currently in beta). To do this click and drag the indicator window on to the price window while keeping the <Shift> key pressed.
                    Alex

                    Comment

                    Working...
                    X