Announcement

Collapse
No announcement yet.

Background colour

Collapse
X
 
  • Filter
  • Time
  • Show
Clear All
new posts

  • Background colour

    Hi!

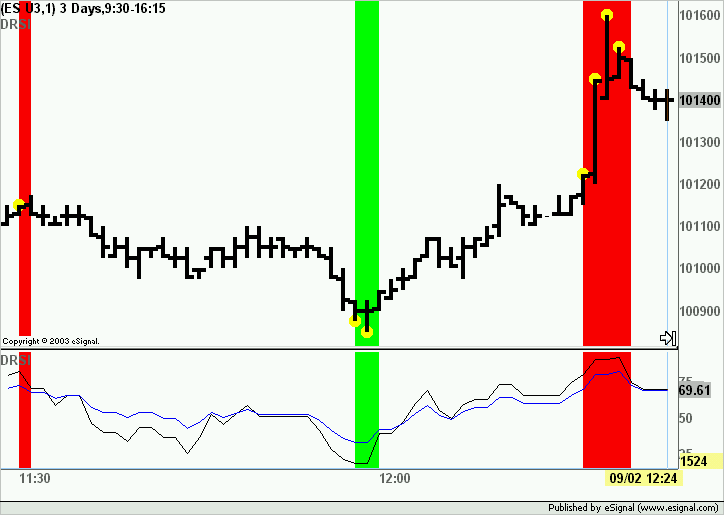
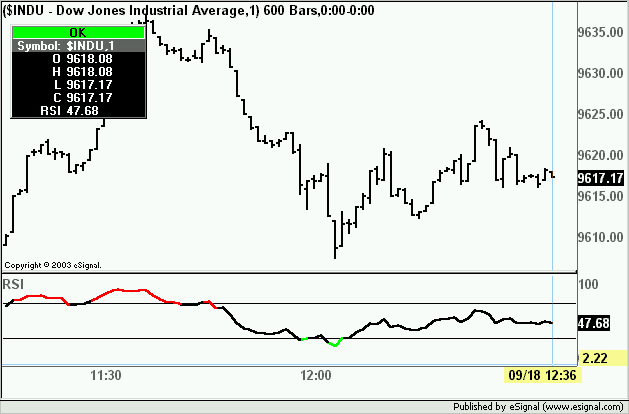
    I programmed an indicator with the Wizard, which should plot an coloured background whenever and as long as an certain RSI-value is reached. I realized that this indicator is always active one bar too long (values are already lower or higher again, but background will still be coloured). Changing the basis of the RSI from close to open doesn´t solve the problem

    Any ideas?

    Thanks

  • #2
    Swingie
    Can you post the efs?
    Alex

    Comment


    • #3
      Sure

      Code:
      //{{EFSWizard_Description
      //
      //    This formula was generated by the Alert Wizard
      //
      //}}EFSWizard_Description 7532
      
      
      //{{EFSWizard_Declarations
      
      var vRSI5 = new RSIStudy(8, "Close");
      var vRSI13 = new RSIStudy(16, "Close");
      var vLastAlert = -1;
      
      //}}EFSWizard_Declarations 12958
      
      
      function preMain() {
         /**
          *  This function is called only once, before any of the bars are loaded.
          *  Place any study or EFS configuration commands here.
          */
      //{{EFSWizard_PreMain
          setPriceStudy(true);
          setStudyTitle("DRSI");
      //}}EFSWizard_PreMain 6201
      
      }
      
      function main() {
         /**
          *  The main() function is called once per bar on all previous bars, once per
          *  each incoming completed bar, and if you don't have 'setComputeOnClose(true)'
          *  in your preMain(), it is also called on every tick.
          */
      
      //{{EFSWizard_Expressions
          //{{EFSWizard_Expression_1
              if (
                  vRSI8.getValue(RSIStudy.RSI) > 80 &&
                  vRSI16.getValue(RSIStudy.RSI) > 50
              ) onAction1()
          //}}EFSWizard_Expression_1 14013
          
          //{{EFSWizard_Expression_2
              else if (
                  vRSI8.getValue(RSIStudy.RSI) < 20 &&
                  vRSI16.getValue(RSIStudy.RSI) < 40
              ) onAction2();
          //}}EFSWizard_Expression_2 14787
          
      //}}EFSWizard_Expressions 50498
      
      
      //{{EFSWizard_Return
          return null;
      //}}EFSWizard_Return 2256
      
      }
      
      function postMain() {
         /**
          *  The postMain() function is called only once, when the EFS is no longer used for
          *  the current symbol (ie, symbol change, chart closing, or application shutdown).
          */
      }
      
      //{{EFSWizard_Actions
          //{{EFSWizard_Action_1
          function onAction1() {
              setBarBgColor(Color.RGB(255,0,0));
              vLastAlert = 1;
          }
          //}}EFSWizard_Action_1 10992
          
          //{{EFSWizard_Action_2
          function onAction2() {
              setBarBgColor(Color.RGB(0,255,0));
              vLastAlert = 2;
          }
          //}}EFSWizard_Action_2 9717
          
      //}}EFSWizard_Actions 39409

      Comment


      • #4
        Swingie
        Actually the efs is giving the correct signals.
        In the attached efs I have simply added the command to plot a yellow circle when the conditions are met. The result can be see in the image below


        What is deceiving is that the background of a bar actually extends to the right of that bar up to the next one thus giving the impression that there is still a signal. The dots clearly indicate that there is none
        Alex
        Attached Files

        Comment


        • #5
          Thank you, Alex!!!

          Comment


          • #6
            RSI

            I am not much of a programmer and am looking for an RSI line that goes Green below 30 and red above 70.

            And here is a simple little vLin study that does very well. Maybe someone can improve it.

            Thanks,
            Steve
            Attached Files

            Comment


            • #7
              Steve
              The attached efs should do what you asked
              All parameters (including the level at which it is to turn red or green) can be modified through Edit Studies.
              Alex

              Attached Files

              Comment


              • #8
                Hi Alex
                I'd like to change chart background color: white when close >= MA; lightgrey when close< MA. But the chart BG is always white. Attached efs for you to examine.
                Dzung Nguyen
                Attached Files

                Comment


                • #9
                  The efs is already doing that. The issue is that it is a very light grey. Either use a different RGB value for the grey or use lightgrey instead of RGB value.
                  Alex

                  Comment


                  • #10
                    I changed lightgrey to lime (attached efs), but the chart BG is still while!
                    Dzung
                    Attached Files

                    Comment


                    • #11
                      At this end the efs is working perfectly (see images with MA plotted for comparison)
                      What version of the software are you using?
                      Alex


                      Comment


                      • #12
                        Oh, what I've expected is the chart BG is lime where/when c<MA and white where/when c>=MA. So the chart will show vertical bands of white and lime. The current efs makes the whole chart BG white or lime depending on the condition (C>=MA or c< MA) of only the last bar of the chart.
                        Dzung

                        Comment


                        • #13
                          In the case of the efs you posted you would need to change setChartBG() to setBarBgColor().
                          However because the efs is written as a non price study that will only paint the background of the indicator window. You would need to add setPriceStudy(true) at which point it will only paint the background of the price bars.
                          Alex

                          Comment


                          • #14
                            Alex
                            I'm aware of the use of setBarBGColor(). In fact, the efs is a modified version of MA Cross Over.efs provided in the Helpers folder of eSignal. The modification was that setBarBGColor() was replaced with setChartBG(). I did this because setBarBGColor()can change BG color of only the pane containing the efs, while expecting that setChartBG() can change the BG color in every panes of the chart. Is there a way to use setChartBG() or any other function to do what I want ?

                            Dzung

                            Comment

                            Working...
                            X