 Tweet
Tweet
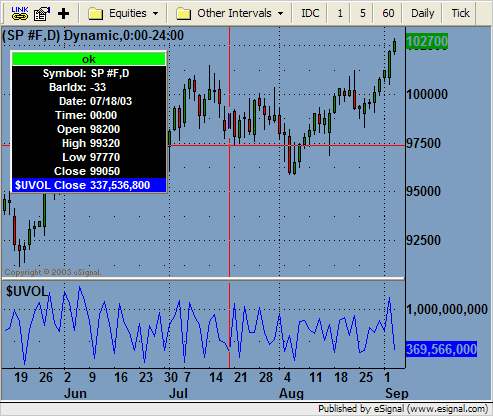
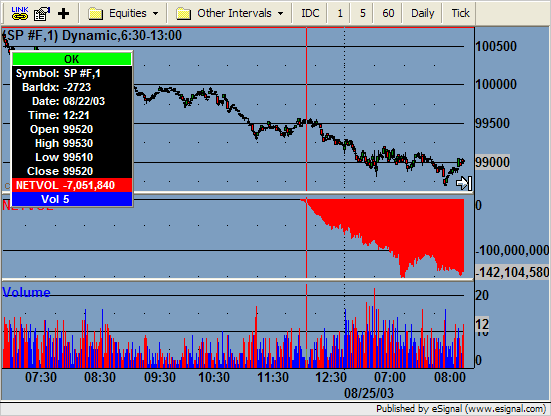
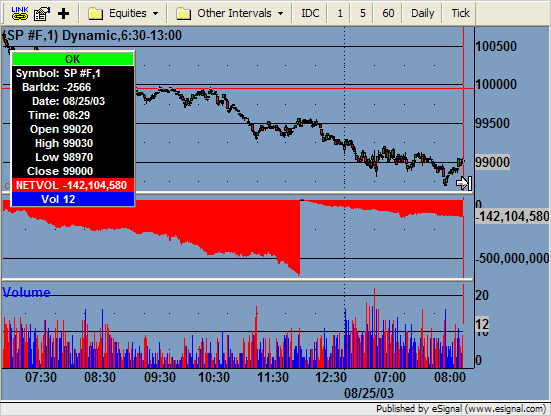
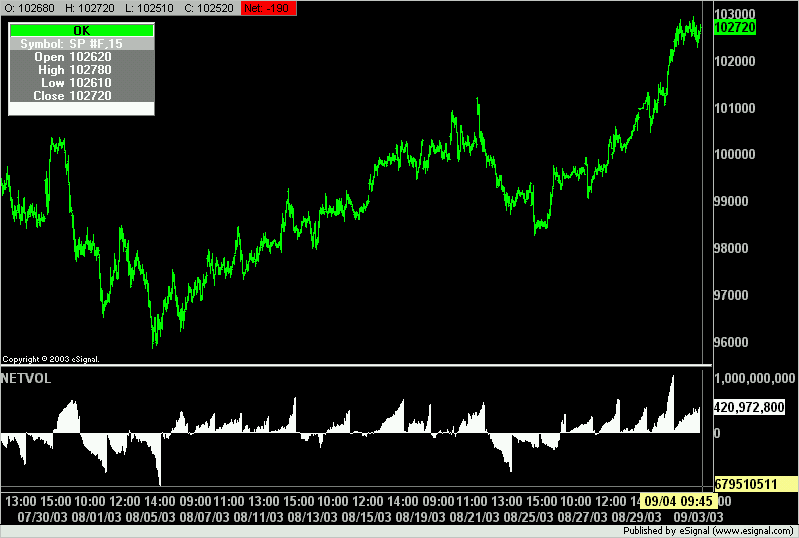
Why is it when I build an indicator based on data from a different symbol (for example: "$UVOL") from the main chart (for example, "SP #F"), only a small subset of the inidata data, "$UVOL", is displayed.
For example, the main chart ("SP #F") displays data for the whole of August, but the indicator based on the close value (close(0,"UVOL") only displays values for the last two days?
For example, the main chart ("SP #F") displays data for the whole of August, but the indicator based on the close value (close(0,"UVOL")
only displays values for the last two days?
Comment