Announcement

Collapse
No announcement yet.

close() - only partial data retrieved

Collapse
X
 
  • Filter
  • Time
  • Show
Clear All
new posts

  • close() - only partial data retrieved

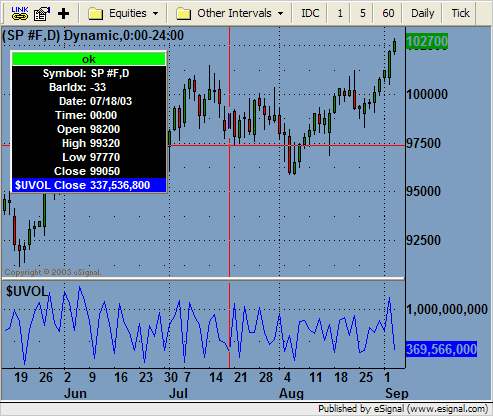
    Why is it when I build an indicator based on data from a different symbol (for example: "$UVOL") from the main chart (for example, "SP #F"), only a small subset of the inidata data, "$UVOL", is displayed.

    For example, the main chart ("SP #F") displays data for the whole of August, but the indicator based on the close value (close(0,"UVOL") only displays values for the last two days?
    Joe

  • #2
    Hello Joe,

    Please post a chart image of what you are seeing and your formula code. You should be able to see data for $UVOL using close(0, 1, "$UVOL").

    Jason K.
    Project Manager
    eSignal - an Interactive Data company

    EFS KnowledgeBase
    JavaScript for EFS Video Series
    EFS Beginner Tutorial Series
    EFS Glossary
    Custom EFS Development Policy

    New User Orientation

    Comment


    • #3
      Jason

      Thanks for the reply. Here's the code:

      function preMain() {
      setComputeOnClose(true);
      setPlotType(PLOTTYPE_HISTOGRAM);
      setStudyTitle("NETVOL");
      setCursorLabelName("NETVOL");
      setDefaultBarFgColor(Color.white);
      }


      function main() {

      var vADVDEC = close(0,1,"$VOLD");
      if(vADVDEC== null) return;

      return vADVDEC;
      }
      Attached Files
      Joe

      Comment


      • #4
        Hello joedonne,

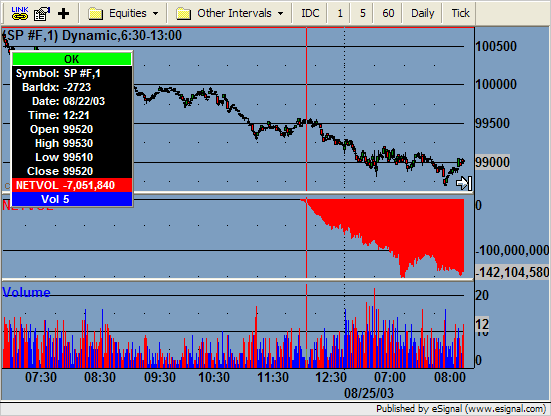
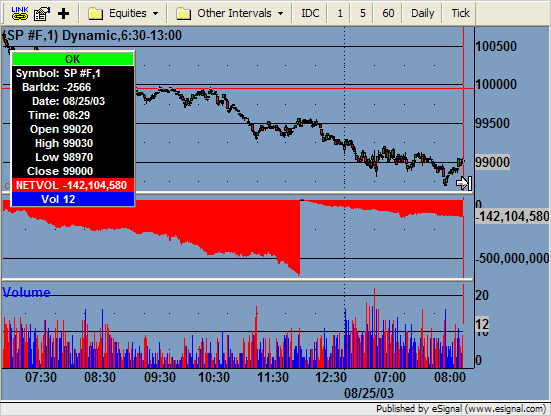
        When you access price data of an external symbol using close() or getValue(), the formula will only grab a certain amount of historical data. If you open another chart, set it to $VOLD and scroll back in time past the 29th, you'll force more data to load. Reload your chart with the formula and you should then see the historical data update.

        Before:


        After loading more $VOLD data in another chart:
        Jason K.
        Project Manager
        eSignal - an Interactive Data company

        EFS KnowledgeBase
        JavaScript for EFS Video Series
        EFS Beginner Tutorial Series
        EFS Glossary
        Custom EFS Development Policy

        New User Orientation

        Comment


        • #5
          Jason

          Thanks for looking into this. Unfortunately, the indicator I'm using is based on four external symbols, so it would mean loading four charts (or one chart and scrolling through four symbols so that the data is cached locally?) and scrolling back for each chart. I could do this, but it seems a lot of effort. I do have a copy of Metastock Pro, which does have a security() function that retrieves data for external symbols (online or offline) upon which a custom indicator can be based. (Unfortuantely, Metastock Pro's formula language and structure leaves a lot to be desired.) So, perhaps, this is one for the suggestion box: that custom indicators automatically request historical data for external symbols they may reference when the main chart is scrolled back.

          Thanks again for your time and help.
          Joe
          Joe

          Comment


          • #6
            Joe
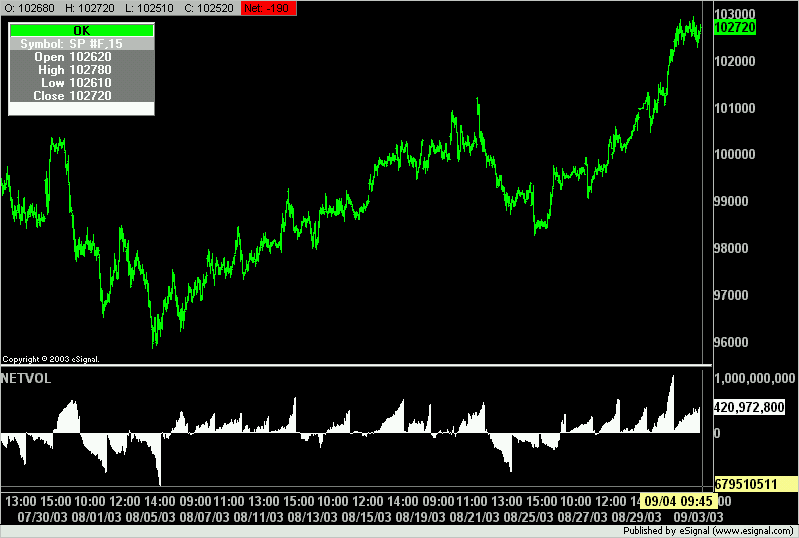
            Have you tried using Time Templates that load a specific number of days rather than Dynamic?
            I used the formula you posted and it will plot all the data without having to first load the symbol and scroll back (see image below).
            Alex

            Comment


            • #7
              Alex, thanks for the reply. Yes, changing the time template from dynamic mode to fixed number of days does fix this problem.

              Unfortunately, the only issue I have now is that because the main chart is a CME symbol (SP #F) with trading hours from 9:30 to 16:15 EST, and the custom indicator is based on a NYSE symbol ($VOLD) with trading hours from 9:30 to 16:00 EST, there's a daily fifteen minute discrepancy between the main chart and the indicator (or a fifteen period discrepancy as I'm using 1 minute bars).

              It seems that Esignal loads the data for the main chart first, then loads the data for the custom indicator and doesn't take into consideration the time difference between the two symbols - see attached chart.

              Is there anyway of applying different time templates to the main chart and the custom indicator? Or will I have to do tricky coding to sync the chart the custom indicator. Or will I have to lose the last fifteen minutes on the main chart (SP #F)?

              Thanks
              Joe
              Attached Files
              Joe

              Comment


              • #8
                Joe

                Is there anyway of applying different time templates to the main chart and the custom indicator? Or will I have to do tricky coding to sync the chart the custom indicator. Or will I have to lose the last fifteen minutes on the main chart (SP #F)?

                No, you cannot apply two different Time Templates and unless you have some way to sync the study through efs the best solution I know of is to always apply the Time Template for the symbol with the shorter trading hours

                Alex

                Comment

                Working...
                X