 Tweet
Tweet
Hi,
I am learning efs at the moment, I just wondering if there is updated documentation on efs for esignal version 12.xxx, I look at efs central it seems the documentation is for esignal 10.
for example I try to draw arrow it works on esignal 10 but not 12.
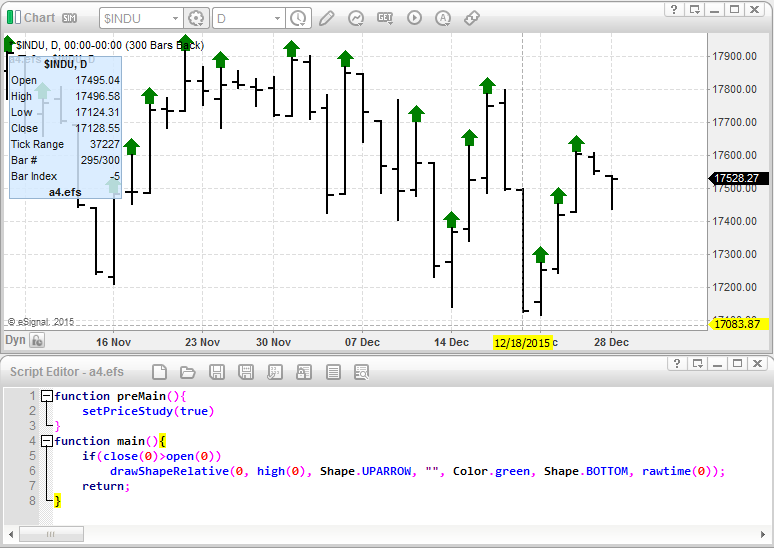
drawShapeRelative(0, high(0), Shape.UPARROW, "", Color.green, Shape.UPARROW);
on esignal 12 I get runtime error
C:/Users/dev/Documents/Interactive Data/Formulas/My Formulas/fred.efs, line 18: Failed to call 'drawShapeRelative': parameter # 6 is invalid.
also is it possible to plot different moving average that I use using different line color and thickness, when I pass the array return value on different moving average in 1 study efs file?
I attach the source code below.
function preMain()
{
setPriceStudy(true);
setComputeOnClose();
setColorPriceBars(true);
setDefaultPriceBarColor(Color.grey);
}
function main()
{
// mark speed line on the chart
var ma1 = sma(3, "Close");
var ma2 = sma(5, "Close");
if((ma1 > ma2) && (close(0) > ma1 ))
{
drawShapeRelative(0, high(0), Shape.UPARROW, "", Color.green, Shape.UPARROW);
}
// mark long term trend on the chart by setting different color on price bar
var longTermTrend1, longTermTrend2;
longTermTrend1 = ema(144, "Close");
longTermTrend2 = sma(200, "Close");
if(longTermTrend1 > longTermTrend2)
{
setPriceBarColor(Color.green);
}
else
{
setPriceBarColor(Color.red);
}
//return();
}
Thank you.
Regards
- Haris -
I am learning efs at the moment, I just wondering if there is updated documentation on efs for esignal version 12.xxx, I look at efs central it seems the documentation is for esignal 10.
for example I try to draw arrow it works on esignal 10 but not 12.
drawShapeRelative(0, high(0), Shape.UPARROW, "", Color.green, Shape.UPARROW);
on esignal 12 I get runtime error
C:/Users/dev/Documents/Interactive Data/Formulas/My Formulas/fred.efs, line 18: Failed to call 'drawShapeRelative': parameter # 6 is invalid.
also is it possible to plot different moving average that I use using different line color and thickness, when I pass the array return value on different moving average in 1 study efs file?
I attach the source code below.
function preMain()
{
setPriceStudy(true);
setComputeOnClose();
setColorPriceBars(true);
setDefaultPriceBarColor(Color.grey);
}
function main()
{
// mark speed line on the chart
var ma1 = sma(3, "Close");
var ma2 = sma(5, "Close");
if((ma1 > ma2) && (close(0) > ma1 ))
{
drawShapeRelative(0, high(0), Shape.UPARROW, "", Color.green, Shape.UPARROW);
}
// mark long term trend on the chart by setting different color on price bar
var longTermTrend1, longTermTrend2;
longTermTrend1 = ema(144, "Close");
longTermTrend2 = sma(200, "Close");
if(longTermTrend1 > longTermTrend2)
{
setPriceBarColor(Color.green);
}
else
{
setPriceBarColor(Color.red);
}
//return();
}
Thank you.
Regards
- Haris -
Comment