Announcement

Collapse
No announcement yet.

drawShapeRelative question

Collapse
X
 
  • Filter
  • Time
  • Show
Clear All
new posts

  • drawShapeRelative question

    Hi,

    I am learning efs at the moment, I just wondering if there is updated documentation on efs for esignal version 12.xxx, I look at efs central it seems the documentation is for esignal 10.

    for example I try to draw arrow it works on esignal 10 but not 12.
    drawShapeRelative(0, high(0), Shape.UPARROW, "", Color.green, Shape.UPARROW);
    on esignal 12 I get runtime error
    C:/Users/dev/Documents/Interactive Data/Formulas/My Formulas/fred.efs, line 18: Failed to call 'drawShapeRelative': parameter # 6 is invalid.

    also is it possible to plot different moving average that I use using different line color and thickness, when I pass the array return value on different moving average in 1 study efs file?


    I attach the source code below.

    function preMain()
    {
    setPriceStudy(true);
    setComputeOnClose();

    setColorPriceBars(true);
    setDefaultPriceBarColor(Color.grey);
    }

    function main()
    {
    // mark speed line on the chart
    var ma1 = sma(3, "Close");
    var ma2 = sma(5, "Close");

    if((ma1 > ma2) && (close(0) > ma1 ))
    {
    drawShapeRelative(0, high(0), Shape.UPARROW, "", Color.green, Shape.UPARROW);
    }


    // mark long term trend on the chart by setting different color on price bar
    var longTermTrend1, longTermTrend2;
    longTermTrend1 = ema(144, "Close");
    longTermTrend2 = sma(200, "Close");

    if(longTermTrend1 > longTermTrend2)
    {
    setPriceBarColor(Color.green);
    }
    else
    {
    setPriceBarColor(Color.red);
    }


    //return();
    }

    Thank you.

    Regards
    - Haris -
  • #2
    hkusumo
    As far as I know the EFS KnowledgeBase is kept up to date to reflect all the changes that are implemented in the latest versions (just look at the Glossary and you will see that a number of the listed functions have been introduced well after 10.6)
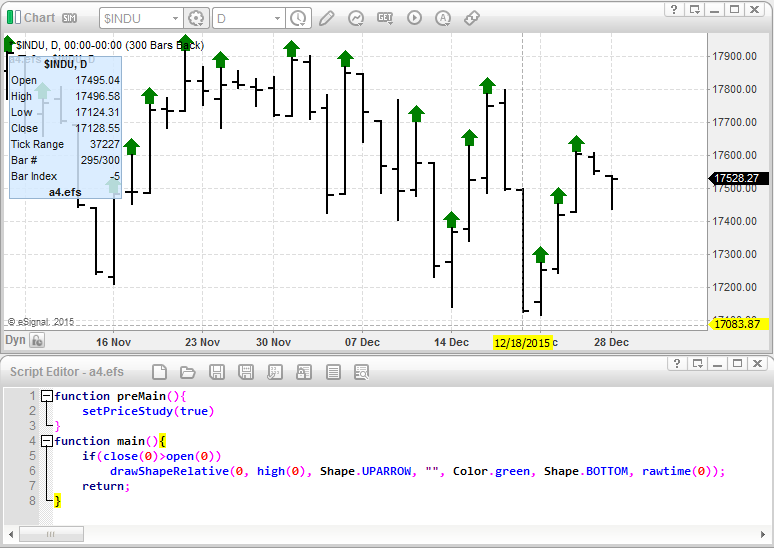
    As to the runtime error you are referring to that is because you are not using a valid flag as the 6th parameter and the fact that 12.x reports it as an error while 10.6 does not is actually an issue in the latter whose error checking is not as stringent.
    Anyhow once you change that with an appropriate flag [see the related article in the EFS KnowledgeBase for the complete list] the function will work as you can see in the enclosed image


    As to your second question if you are asking whether you can return multiple averages using the same script then that is possible by returning an array eg return new Array (ma1, ma2, etc) or return [ma1, ma2, etc]
    To apply different colors and or thicknesses to them you need to use the series index parameter in the related functions ie setDefaultBarFgColor(), setBarFgColor() etc. See the EFS KnowledgeBase and search the forum as this has been covered at length before and there are plenty of examples available. For that matter just look at some of the efs that are installed with eSignal (eg Bollinger Bands, Envelope and the like all of which return multiple plots)
    Alex


    Originally posted by hkusumo View Post
    Hi,

    I am learning efs at the moment, I just wondering if there is updated documentation on efs for esignal version 12.xxx, I look at efs central it seems the documentation is for esignal 10.

    for example I try to draw arrow it works on esignal 10 but not 12.
    drawShapeRelative(0, high(0), Shape.UPARROW, "", Color.green, Shape.UPARROW);
    on esignal 12 I get runtime error
    C:/Users/dev/Documents/Interactive Data/Formulas/My Formulas/fred.efs, line 18: Failed to call 'drawShapeRelative': parameter # 6 is invalid.

    also is it possible to plot different moving average that I use using different line color and thickness, when I pass the array return value on different moving average in 1 study efs file?


    I attach the source code below.

    function preMain()
    {
    setPriceStudy(true);
    setComputeOnClose();

    setColorPriceBars(true);
    setDefaultPriceBarColor(Color.grey);
    }

    function main()
    {
    // mark speed line on the chart
    var ma1 = sma(3, "Close");
    var ma2 = sma(5, "Close");

    if((ma1 > ma2) && (close(0) > ma1 ))
    {
    drawShapeRelative(0, high(0), Shape.UPARROW, "", Color.green, Shape.UPARROW);
    }


    // mark long term trend on the chart by setting different color on price bar
    var longTermTrend1, longTermTrend2;
    longTermTrend1 = ema(144, "Close");
    longTermTrend2 = sma(200, "Close");

    if(longTermTrend1 > longTermTrend2)
    {
    setPriceBarColor(Color.green);
    }
    else
    {
    setPriceBarColor(Color.red);
    }


    //return();
    }

    Thank you.

    Regards
    - Haris -

    Comment


    • #3
      Hi ACM,

      Thank you for your reply, I found the drawShapeRelative function spec on efs knowledge base that you mention, and it works after I made the changes.
      I will do search on the forum on setting different line thickness and style for different MA line on the chart.

      Thanks again for your help.

      Regards
      - Haris -

      Comment


      • #4
        Haris
        You are welcome
        Alex


        Originally posted by hkusumo View Post
        Hi ACM,

        Thank you for your reply, I found the drawShapeRelative function spec on efs knowledge base that you mention, and it works after I made the changes.
        I will do search on the forum on setting different line thickness and style for different MA line on the chart.

        Thanks again for your help.

        Regards
        - Haris -

        Comment

        Working...
        X