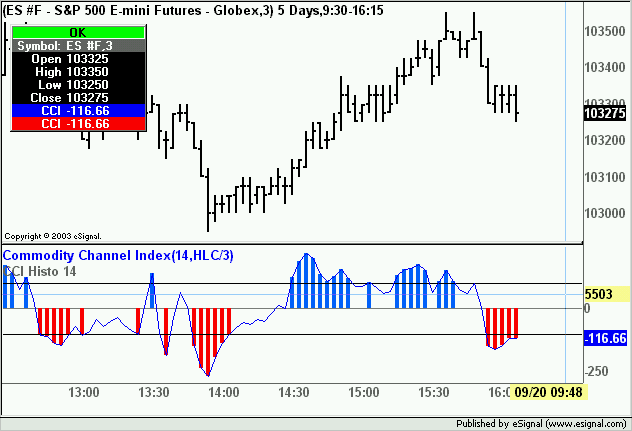
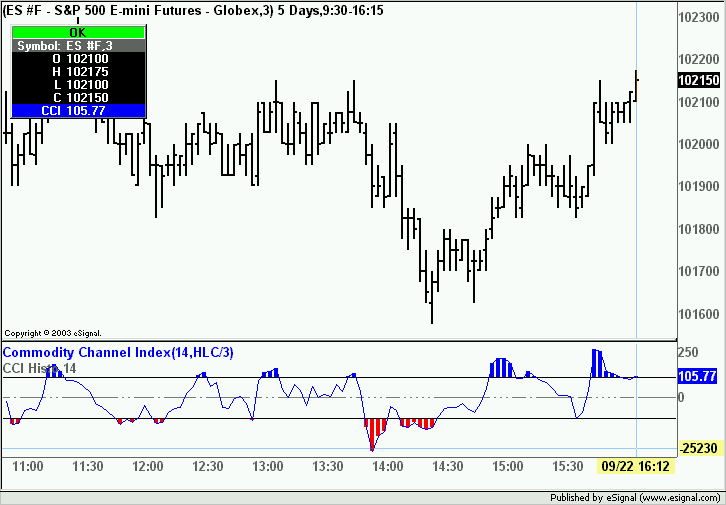
Is it possible to only show a histogram for an area such as greater than 100 or less than -100 ? I can't seem to get it to display the way I want in this EFS.
var study = new CCIStudy(14, "(H+L+C)/3");
function preMain() {
setCursorLabelName("CCI");
setStudyTitle("CCI Histo 14");
//addBand(250.0, PS_SOLID, 1, Color.black);
addBand(0.0, PS_SOLID, 1, Color.grey);
//addBand(-250.0, PS_SOLID, 1, Color.black);
}
function main() {
setPlotType(PLOTTYPE_HISTOGRAM );
setDefaultBarThickness(4,0);
if (study.getValue(CCIStudy.CCI)>0)
{setDefaultBarFgColor(Color.RGB(0,100,255),0);}
if (study.getValue(CCIStudy.CCI)<0)
{setDefaultBarFgColor(Color.red,0);}
return study.getValue(CCIStudy.CCI);
}


Comment