Announcement

Collapse
No announcement yet.

Histogram

Collapse
X
 
  • Filter
  • Time
  • Show
Clear All
new posts

  • Histogram

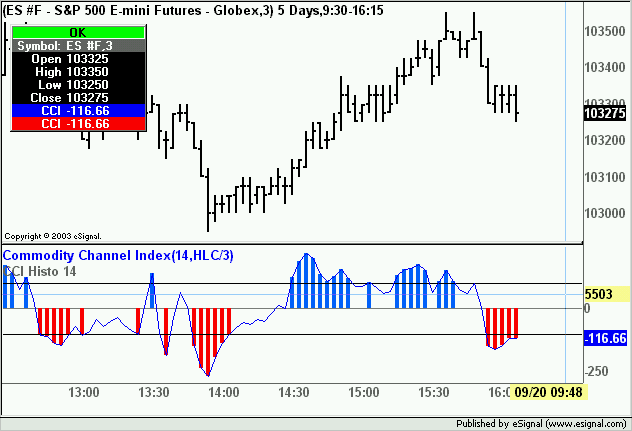
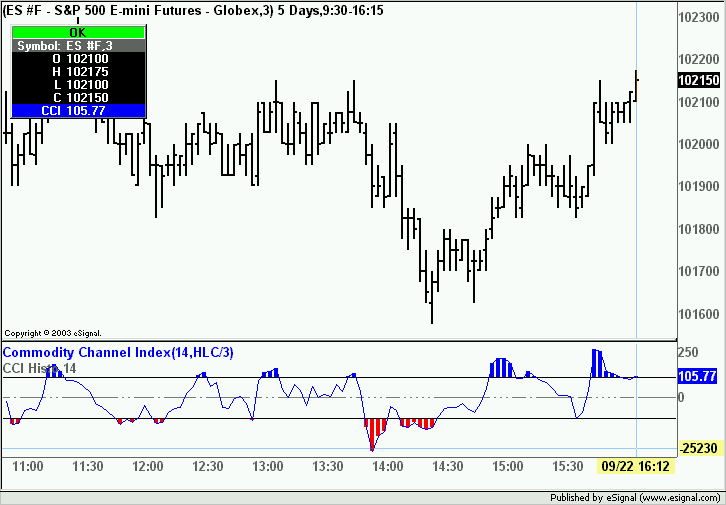
    Is it possible to only show a histogram for an area such as greater than 100 or less than -100 ? I can't seem to get it to display the way I want in this EFS.


    var study = new CCIStudy(14, "(H+L+C)/3");

    function preMain() {
    setCursorLabelName("CCI");
    setStudyTitle("CCI Histo 14");

    //addBand(250.0, PS_SOLID, 1, Color.black);
    addBand(0.0, PS_SOLID, 1, Color.grey);
    //addBand(-250.0, PS_SOLID, 1, Color.black);
    }

    function main() {
    setPlotType(PLOTTYPE_HISTOGRAM );
    setDefaultBarThickness(4,0);

    if (study.getValue(CCIStudy.CCI)>0)
    {setDefaultBarFgColor(Color.RGB(0,100,255),0);}

    if (study.getValue(CCIStudy.CCI)<0)
    {setDefaultBarFgColor(Color.red,0);}

    return study.getValue(CCIStudy.CCI);
    }

  • #2
    brianb
    Modify the values in setStudyMax() and setStudyMin() to ones of your choice.
    Also applied some corrections to the efs with comments
    Alex

    PHP Code:
    var study = new CCIStudy(14"HLC/3"); //this has been corrected

    function preMain() {
    setCursorLabelName("CCI");
    setStudyTitle("CCI Histo 14");
    setPlotType(PLOTTYPE_HISTOGRAM ); //this has been moved
    setDefaultBarThickness(4,0); //this has been moved
    setStudyMax(100); //this will set the upper limit of the window
    setStudyMin(-100); //this will set the lower limit

    //addBand(250.0, PS_SOLID, 1, Color.black);
    addBand(0.0PS_SOLID1Color.grey);
    //addBand(-250.0, PS_SOLID, 1, Color.black);
    }

    function 
    main() {

    if (
    study.getValue(CCIStudy.CCI)>0
    {
    setBarFgColor(Color.RGB(0,100,255));} //this has been corrected

    if (study.getValue(CCIStudy.CCI)<0
    {
    setBarFgColor(Color.red);} //this has been corrected

    return study.getValue(CCIStudy.CCI);

    Last edited by ACM; 09-19-2003, 08:28 PM.

    Comment


    • #3
      hmmm, I always just returned +100 and -100

      ie

      return new Array(cc, 100, -100)

      This way lines can be drawn at those levels also, but I suppose addBand does the same thing.

      Comment


      • #4
        Alex
        Thanks for cleaning up the formula but it is not yet displaying what I was attempting to do. I should have been more clear in describing my goal.
        I would like to merge the histogram with a 14 period HLC/3 CCI study and have the histogram only display values over 100 and under -100, leaving the zone between these 2 points histogram free. Is this possible?

        Also
        I loaded the revised histogram efs along with the original one and merged them with identical CCI studies and noticed the new histogram is overshooting the CCI study line. I reloaded and experimented with the min max values but could not get it to display correctly. Any thoughts on this?

        Bottom pane is original, middle pane is revised version.
        Attached Files

        Comment


        • #5
          //edited

          var study = new CCIStudy(14, "HLC/3"); //this has been corrected

          function preMain() {
          setCursorLabelName("CCI");
          setStudyTitle("CCI Histo 14");
          setPlotType(PLOTTYPE_HISTOGRAM ); //this has been moved
          setDefaultBarThickness(4,0); //this has been moved
          setStudyMax(100); //this will set the upper limit of the window
          setStudyMin(-100); //this will set the lower limit

          //addBand(250.0, PS_SOLID, 1, Color.black);
          addBand(0.0, PS_SOLID, 1, Color.grey);
          //addBand(-250.0, PS_SOLID, 1, Color.black);
          }

          function main() {

          if (study.getValue(CCIStudy.CCI)>100) {
          {setBarFgColor(Color.RGB(0,100,255)); //this has been corrected
          return study.getValue(CCIStudy.CCI);
          }

          if (study.getValue(CCIStudy.CCI)<-1000) {
          setBarFgColor(Color.red);} //this has been corrected
          return study.getValue(CCIStudy.CCI);
          }
          }

          Comment


          • #6
            The overshooting is gone but so is the red histogram.

            On the plus side the histogram only prints if values equal or exceed +100.

            Comment


            • #7
              var study = new CCIStudy(14, "HLC/3"); //this has been corrected

              function preMain() {
              setCursorLabelName("CCI");
              setStudyTitle("CCI Histo 14");
              setPlotType(PLOTTYPE_HISTOGRAM ); //this has been moved
              setDefaultBarThickness(4,0); //this has been moved
              setStudyMax(100); //this will set the upper limit of the window
              setStudyMin(-100); //this will set the lower limit

              //addBand(250.0, PS_SOLID, 1, Color.black);
              addBand(0.0, PS_SOLID, 1, Color.grey);
              //addBand(-250.0, PS_SOLID, 1, Color.black);
              }

              function main() {

              if (study.getValue(CCIStudy.CCI)>100) {
              {setBarFgColor(Color.RGB(0,100,255)); //this has been corrected
              return study.getValue(CCIStudy.CCI);
              }

              if (study.getValue(CCIStudy.CCI)<-100) {
              setBarFgColor(Color.red);} //this has been corrected
              return study.getValue(CCIStudy.CCI);
              }
              }

              Comment


              • #8
                brianb
                The enclosed efs plots blue and red histogram bars only if CCI is above 100 or below -100 respectively.
                I have taken out the setStudyMax() and setStudyMin() so that in the overlay you get the same scales between studies hence no overshoot.
                Alex


                PHP Code:
                var study = new CCIStudy(14"HLC/3"); 

                function 
                preMain() {
                setCursorLabelName("CCI");
                setStudyTitle("CCI Histo 14");
                setShowCursorLabel(false); //comment this line if you want to see the value in the Cursor Window
                setPlotType(PLOTTYPE_HISTOGRAM ); 
                setDefaultBarThickness(4,0); 
                addBand(0.0PS_SOLID1Color.grey);

                }

                function 
                main() {

                if (
                study.getValue(CCIStudy.CCI)>100)
                setBarFgColor(Color.RGB(0,100,255));

                else if(
                study.getValue(CCIStudy.CCI)<-100
                setBarFgColor(Color.red);

                else if (
                1==1)
                return ;

                return 
                study.getValue(CCIStudy.CCI);


                Last edited by ACM; 09-20-2003, 07:41 PM.

                Comment


                • #9
                  That fixed it. Thanks Alex and dloomis. Too bad there isn't a way to tell it to start printing from a point of choice like + or - 100 only.

                  Comment


                  • #10
                    brianb
                    There actually is a way by adding a few lines to the efs.
                    Alex


                    PHP Code:
                    var study = new CCIStudy(14"HLC/3"); 
                    var 
                    vHist1 100;
                    var 
                    vHist2 = -100;

                    function 
                    preMain() {
                    setCursorLabelName("CCI");
                    setStudyTitle("CCI Histo 14");
                    setShowCursorLabel(false); //comment this line if you want to see the value in the Cursor Window
                    setPlotType(PLOTTYPE_HISTOGRAM ,0); 
                    setPlotType(PLOTTYPE_HISTOGRAM ,1);
                    setPlotType(PLOTTYPE_HISTOGRAM ,2);
                    setDefaultBarThickness(4,0); 
                    setDefaultBarThickness(4,1); 
                    setDefaultBarThickness(4,2); 
                    setDefaultBarFgColor(Color.black,0);
                    setDefaultBarFgColor(Color.white,1);
                    setDefaultBarFgColor(Color.white,2);
                    addBand(0.0PS_SOLID1Color.grey);

                    }

                    function 
                    main() {

                    if (
                    study.getValue(CCIStudy.CCI)>100)
                    setBarFgColor(Color.blue,0);

                    else if(
                    study.getValue(CCIStudy.CCI)<-100
                    setBarFgColor(Color.red,0);

                    else if (
                    1==1)
                    return ;

                    return new Array (
                    study.getValue(CCIStudy.CCI),vHist1,vHist2);


                    Last edited by ACM; 09-22-2003, 01:27 PM.

                    Comment

                    Working...
                    X