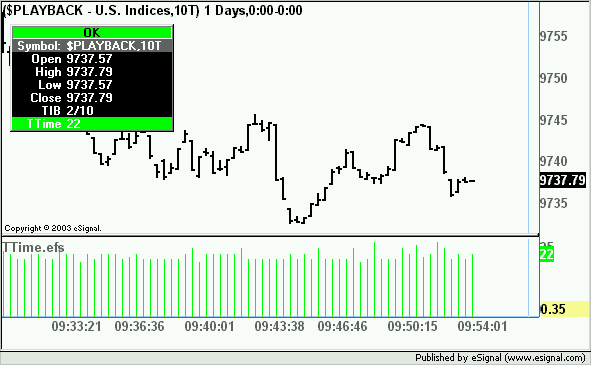
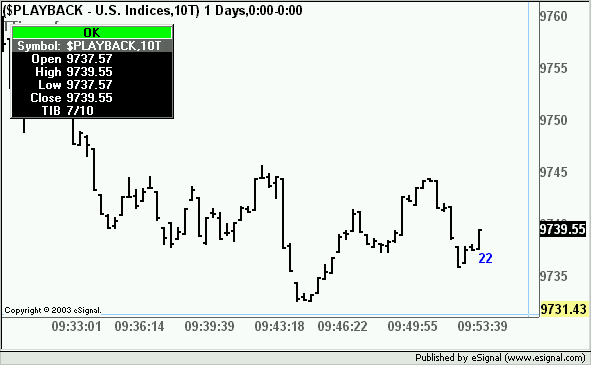
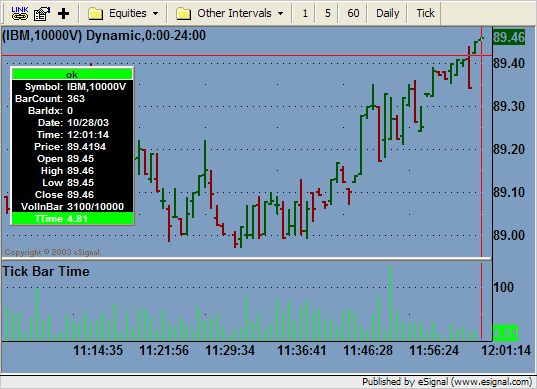
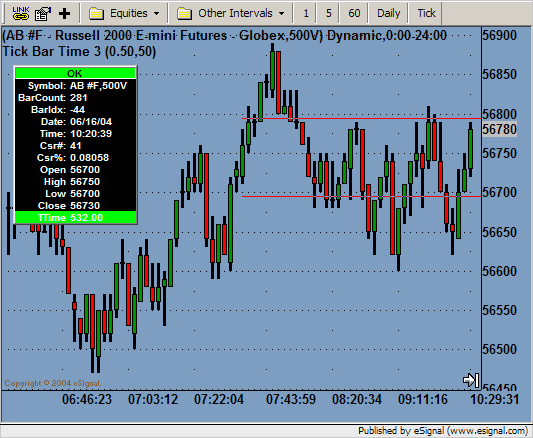
Could this study be made to plot directly under the bar/candle it is plotting? In real time?
function preMain() {
setStudyTitle("");
setCursorLabelName("TTime", 0);
setDefaultBarStyle(PS_SOLID, 0);
setDefaultBarFgColor(Color.lime, 0);
setDefaultBarThickness(1, 0);
setPlotType(PLOTTYPE_HISTOGRAM, 0);
}
function main(){
tickTime=(getMinute()-getMinute(-1))*60+getSecond()-getSecond(-1);
if(tickTime>0)
return tickTime;
else return 0;
//if the bar takes more than one hour this logic will be wrong, but who cares
Any help would be appreciated.


Comment