Announcement

Collapse
No announcement yet.

Help with tickbartime.efs

Collapse
X
 
  • Filter
  • Time
  • Show
Clear All
new posts

  • Help with tickbartime.efs

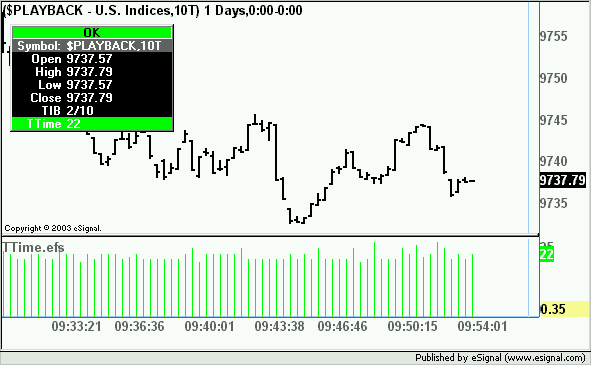
    Could this study be made to plot directly under the bar/candle it is plotting? In real time?


    function preMain() {
    setStudyTitle("");
    setCursorLabelName("TTime", 0);
    setDefaultBarStyle(PS_SOLID, 0);
    setDefaultBarFgColor(Color.lime, 0);
    setDefaultBarThickness(1, 0);
    setPlotType(PLOTTYPE_HISTOGRAM, 0);
    }

    function main(){
    tickTime=(getMinute()-getMinute(-1))*60+getSecond()-getSecond(-1);
    if(tickTime>0)
    return tickTime;
    else return 0;
    //if the bar takes more than one hour this logic will be wrong, but who cares


    Any help would be appreciated.

  • #2
    Himalaya
    Not exactly sure as to what you want to plot so here are two sets of code with corresponding images showing the results.
    Alex

    PHP Code:
    function preMain() {
    setStudyTitle("");
    setCursorLabelName("TTime"0);
    setDefaultBarStyle(PS_SOLID0);
    setDefaultBarFgColor(Color.lime0);
    setDefaultBarThickness(10);
    setPlotType(PLOTTYPE_HISTOGRAM0);
    }

    function 
    main(){

    var 
    tickTime=(getMinute()-getMinute(-1))*60+getSecond()-getSecond(-1);

    if(
    tickTime<0)
    return 
    0;

    return  
    tickTime;


    PHP Code:
    function preMain() {
    setPriceStudy(true);
    setStudyTitle("");
    setShowCursorLabel(false);
    }

    function 
    main(){

    var 
    tickTime=(getMinute()-getMinute(-1))*60+getSecond()-getSecond(-1);

    if(
    tickTime>0)
    drawTextRelative(0,low(),tickTime,Color.blue,Color.white,Text.BOLD|Text.TOP,"Arial",12,1);

    return  ;

    Comment


    • #3
      TT

      Alex,

      Thanks for taking a look at this.

      It still seems that the time histogram is still offset +1 from the its actual price bar.

      Also it gives a lot of zero seconds bars

      I run volume bars/candles on most all of my charts, could this cause a problem?

      Basically looking for a way to measure how many seconds it took to build each volume bar/candle, in real time
      Attached Files

      Comment


      • #4
        Hello Himalaya,

        I think this might be what you need. Test it out and let me know.

        TickBarTime2.efs


        Jason K.
        Project Manager
        eSignal - an Interactive Data company

        EFS KnowledgeBase
        JavaScript for EFS Video Series
        EFS Beginner Tutorial Series
        EFS Glossary
        Custom EFS Development Policy

        New User Orientation

        Comment


        • #5
          Jason/TickBarTime2.efs

          Jason,

          Would it be possible to take the TickBarTime2.efs and add the feature of drawing two horizontal lines x points/ticks above and below the midpoint of a bar if that bar's TickBarTime was less than x seconds?

          The attached gif shows what the study would look lilke.

          The TickBarTime2.efs is measuring the speed of trades when placed on volume/tick bars. If the horizontal lines could be drawn around this increased speed of trade area it would create a "Speed Trap" to trade off of.

          Thanks in advance

          Himalaya
          Attached Files

          Comment


          • #6
            Hello Himalaya,

            We can't draw lines on the price window from a non-price study. You'll have to run a second formula as a price study that does the line drawing. Try the following, TickBarTime3.efs.

            Jason K.
            Project Manager
            eSignal - an Interactive Data company

            EFS KnowledgeBase
            JavaScript for EFS Video Series
            EFS Beginner Tutorial Series
            EFS Glossary
            Custom EFS Development Policy

            New User Orientation

            Comment


            • #7
              Thank you Jason

              Thank you Jason

              Does the job perfectly!

              Himalaya

              Comment

              Working...
              X