Announcement

Collapse
No announcement yet.

EFS Studies

Collapse
This topic is closed.
X
X
 
  • Filter
  • Time
  • Show
Clear All
new posts

  • Compradun
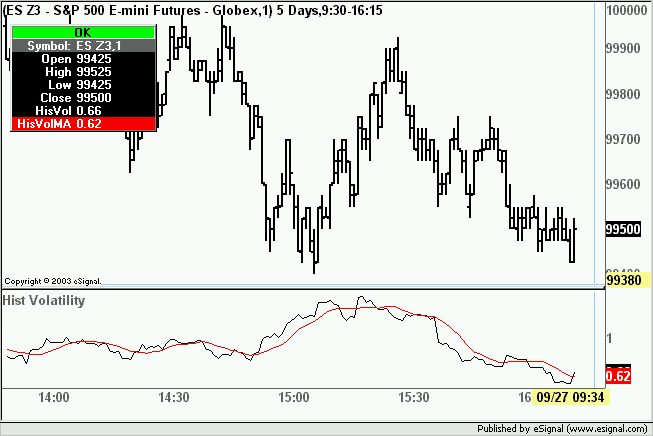
    I think the attached efs does what you asked.
    All modifications are commented in the efs itself. I am not absolutely positive the location of getBarState() in the formula is ideal
    but I have run the efs on Tick Replay and as far as I can see I am not having any drift issues.
    Alex
    Attached Files

    Comment


    • May I just say thank-you for the volatilityma study too? I was looking for it, did a search and hey presto Great stuff.
      Helen

      Comment


      • New EFS Study

        Our next study is the Intraday Intensity Indicator by John Bollinger.

        Volume Based > [eSignal EFS Indicators]

        Download: http://share.esignal.com/download.js...yIntensity.efs

        Category: Indicator > Miscellaneous

        Description:

        This indicator is created by John Bollinger. It is calculated according to this formula:

        IntradayIntensity = SUM{((2 * Close-High-Low)/(High-Low)) * Volume} / SUM{Volume}

        Usage: This indicator is a good tool for basic trend identification and confirmation. It is also useful for diagnosing tags of the bands and divergence identification.


        No Inputs

        EFS Code:

        Code:
        /*******************************************************************
        Provided By	: TS Support, LLC for eSignal. (c) Copyright 2002  
        ********************************************************************/
        
        function preMain()
        {
            setStudyTitle("Intraday Intensity");
            setCursorLabelName("Intraday Intensity", 0);
            setDefaultBarFgColor(Color.blue, 0);
            addBand(0, PS_SOLID, 1, Color.black);
        }
        
        function main() {
        	var i;
        	xSum = 0;
        	ySum = 0;
        	for(i = -20; i <= 0; i++){
        		if(high(i) - low(i) != 0)
        			xSum += (2 * close(i) - high(i) - low(i)) *  volume(i) / (high(i) - low(i));
        		ySum += volume(i);
        	}
        	return xSum / ySum;
        }

        Comment


        • EFS Study ##

          Our next study is the Mobility Oscillator.

          Volume Based > [eSignal EFS Indicators]

          Download: http://share.esignal.com/download.js...ile=MobOsc.efs

          Category: Indicator > Oscillators

          Description:

          The price distribution function, which analyzes the distribution of prices over a lookback period, is useful for predicting price mobility. Here's a new method called the mobility oscillator that will allow you to do so.

          Price mobility, the ease with which prices move, can be assessed by constructing price distribution functions and determining congestion and the location of the current price compared with the congestion. That is not to say that moves will happen, since other external factors not in the market influence moves, but that it is easier. When congestion develops and the current price is in a congested region, an abrupt move often follows.


          Inputs:

          M - number of intervals
          LookBack - lookback period

          EFS Code:

          Code:
          /*******************************************************************
          Provided By	: Developed by TS Support, LLC for eSignal. (c) Copyright 2002 
          ********************************************************************/
          
          function preMain()
          {
              setStudyTitle("Mobility Oscillator");
              setCursorLabelName("MobilityOsc");
          }
          function main(M, LookBack)
          {
              if (M == null) M = 10;
              if (LookBack == null) LookBack = 14;
              var High = getValue("High", 0, -(LookBack * 2 + 2));
              var Low = getValue("Low", 0, -(LookBack * 2 + 2));
              var Close = getValue("Close", 0, -(LookBack * 2 + 2));
              var i = 0;
              var j = 0;
              var HMax = High[0];
              var LMin = Low[0];
              for (i = 0; i < LookBack; i++)
              {
                  if (HMax < High[i]) HMax = High[i];
                  if (LMin > Low[i]) LMin = Low[i];
              }
              var RX = (HMax - LMin) / M;
              var IMX = 1;
              var BU = 0.0;
              var BL = 0.0;
              var BUpdf = 0.0;
              var BLpdf = 0.0;
              var Value99 = 0.0;
              var PDFVar = 0.0;
              var PDF = 0.0;
              var PDFMX = 0.0;
              var PDFC = 0.0;
              for (i = 1; i <= M; i++)
              {
                  BU = LMin + i * RX;
                  BL = BU - RX;
                  BLpdf = LMin + (i - 1) * RX;
                  BUpdf = LMin + i * RX;
                  PDFVar = 0.0;
                  for (j = 0; j < LookBack; j++)
                  {
                      if (High[i + j] <= BUpdf) PDFVar++;
                      if ((High[i + j] <= BUpdf)||(Low[i + j] >= BUpdf)) Value99 = 1;
                      else PDFVar = PDFVar + (BUpdf - Low[i + j]) / (High[i + j]-Low[i + j]);
                      if (High[i + j] <= BLpdf) PDFVar--;
                      if ((High[i + j] <= BLpdf)||(Low[i + j] >=  BLpdf)) Value99 = 1;
                      else PDFVar = PDFVar - (BLpdf - Low[i + j]) / (High[i + j] - Low[i + j]);
                  }
                  PDF = PDFVar / LookBack;
                  if (i == 1) PDFMX = PDF;
                  if (PDF > PDFMX) 
                  {
                      IMX = i;
                      PDFMX = PDF;
                  }
                  if (i == 1) PDFC = PDF;
                  if ((Close[LookBack - 1] > BL)&&(Close[LookBack - 1] <= BU)) PDFC = PDF;
              }
              var PMO = LMin + (IMX - 0.5) * RX;
              var MO = 100 * (1 - PDFC / PDFMX);
              if (Close[LookBack - 1] < PMO) MO = -MO;
              return -MO;
          }

          Comment


          • EFS Study ##

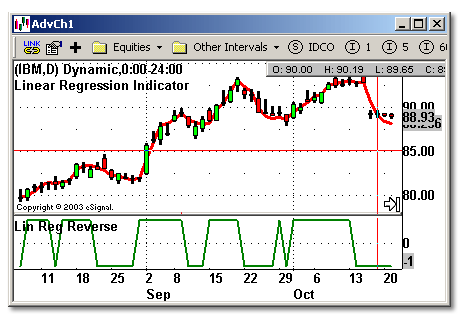
            Our next study is the Linear Regression Indicators set.

            Volume Based > [eSignal EFS Indicators]

            Download: http://share.esignal.com/download.js...nIndicator.efs
            Download: http://share.esignal.com/download.js...lIndicator.efs

            Category: Indicator > Miscellaneous

            Description:

            This is a low lag indicator that identifies short-term price reversals. It is based on linear regression. To get more information please read "Trade the Price Swings" by Barbara Star article in the resent Stocks&Commotidies magazine issue.


            Inputs:

            Length - number of bars to be used in calculation

            EFS Code:


            Linear Regression Indicator:

            Code:
            // Provided by eSignal (c) 2003 //
            ////////////////////////////////////////////////////////////////
            function preMain()
            {
            	setStudyTitle("Linear Regression Indicator");
            	setCursorLabelName("LR", 0);
            	setDefaultBarFgColor(Color.red, 0);
            	setDefaultBarThickness(3, 0);
            	setPriceStudy(true);
            }
            
            function main(Length) {
            	if(Length == null) Length = 5;
            	var sum = 0;
            	var i = 0;
            	var mt = 0;
            	var wt = 0;
            	for(i = Length; i > 0; i--)
            	sum += (i - (Length + 1) / 3) * close(i - Length);
            	wt = 6 / (Length * (Length + 1)) * sum
            	return wt;
            }


            Linear Regression Reversal Indicator:

            Code:
            // Provided by eSignal (c) 2003 //
            function preMain()
            {
            	setStudyTitle("Lin Reg Reverse");
            	setCursorLabelName("LRR", 0);
            	setDefaultBarFgColor(Color.green, 0);
            	setDefaultBarThickness(2, 0);
            }
            function main(Length) {
            	if(Length == null) Length = 5;
            	var sum = 0;
            	var i = 0;
            	var mt = 0;
            	var WT = 0;
            	var vWT2 = getGlobalValue( "WT2" );
            	if (vWT2 == null) {
            		setGlobalValue("WT2", 0 );
            	}
            	for(i = Length; i > 0; i--)
            		sum += (i - (Length + 1) / 3) * close(i - Length);
            	WT = 6 / (Length * (Length + 1)) * sum
            
            	if(WT >= vWT2)
            	{
            		setGlobalValue( "WT2", WT );
            		return 1;
            	}
            	else
            	{
            		setGlobalValue( "WT2", WT );
            		return -1;
            	}
            	return;
            }

            Comment


            • EFS Study

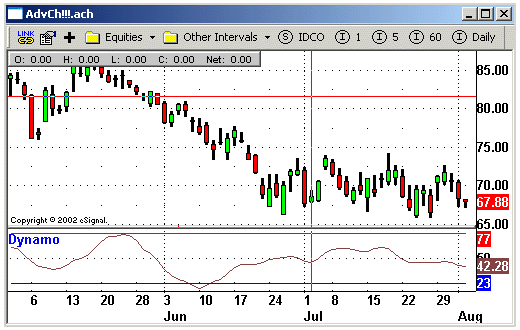
              Our next study is the Dynamo oscillator.

              Oscillators > Dynamo [eSignal EFS Indicators]

              Download: http://share.esignal.com/download.js...ile=Dynamo.efs

              Category: Indicator > Oscillators

              Description:

              Dynamo Oscillator is calculated according to this formula:

              Dynamo = Mc - ( MAo - O ),

              where:

              Mc = the midpoint of the oscillator
              MAo = a moving average of the oscillator
              O = the oscillator

              Usage:

              This concept can be applied to most any oscillator to improve its results.

              Example: Applying the Dynamo Oscillator to a 5-period %K slowed 3 periods Stochastic Oscillator would give:

              50-(Mov(Stoch(5,3),21,S)-Stoch(5,3))

              where:

              Mc = Stochastic Oscillator's midpoint = 50
              MAo = Moving average of the Stochastic = Mov(Stoch(5,3),21,S
              O = Stochastic Oscillator = Stoch(5,3)


              Inputs:

              OscLen - number of bars to calculate an oscillator
              MaLen - number of bars to calculate a moving average
              LowBand - oversold line
              HiBand - over bought line

              EFS Code:

              Code:
              /*******************************************************************
              Description	: This Indicator plots Dynamo Oscillator
              Provided By	: Developed by TS Support, LLC for eSignal. (c) Copyright 2002 
              ********************************************************************/
              
              function preMain()
              {
                  setStudyTitle("Dynamo");
                  setCursorLabelName("Dynamo", 0);
                  setCursorLabelName("LowBand", 1);
                  setCursorLabelName("HiBand", 2);
                  setDefaultBarFgColor(Color.brown, 0);
                  setDefaultBarFgColor(Color.blue, 1);
                  setDefaultBarFgColor(Color.red, 2);
              }
              var FastK = null;
              var LowestSoFar = null;
              var HighestSoFar = null;
              var LowestSoFar_1 = null;
              var HighestSoFar_1 = null;
              
              function main(OscLen, MALen, LowBand, HiBand)
              {
                  var BarState = getBarState();
                  if (OscLen == null) OscLen = 10;
                  if (MALen == null) MALen = 20;
                  if (LowBand == null) LowBand = 23;
                  if (HiBand == null) HiBand = 77;
                  var i = 0.0;
                  var MaxLen = Math.max(OscLen, MALen);
                  if (FastK == null)
                  {
                      FastK = new Array(MaxLen);
                      for (i = 0; i < MaxLen; i++)
                      {
                          FastK[i] = 0.0;
                      }
                  }
                  if (BarState == BARSTATE_NEWBAR)
                  {
                      for (i = MaxLen - 1; i > 0; i--)
                      {
                          FastK[i] = FastK[i - 1];
                      }
                  }
                  var High = getValue("High", 0, -OscLen);
                  var Low = getValue("Low", 0, -OscLen);
                  var Close = getValue("Close", 0, -OscLen);
                  var HH = High[0];
                  var LL = Low[0];
                  for (i = 0; i < OscLen; i++)
                  {
                      if (HH < High[i]) HH = High[i];
                      if (LL > Low[i]) LL = Low[i];
                  }
                  var Value1 = LL;
                  var Value2 = HH - Value1;
                  var Value3 = Close[0];
                  if (Value2 > 0)
                  {
                      FastK[0] = (Value3 - Value1) / Value2 * 100;
                  }
                  else FastK[0] = 0.0;
                  MAAvg = 0.0;
                  OscAvg = 0.0;
                  for (i = 0; i < MaxLen; i++)
                  {
                      if (i < MALen) MAAvg += FastK[i];
                      if (i < OscLen) OscAvg += FastK[i];
                  }
                  MAVal = MAAvg / MALen;
                  OscAvg /= OscLen;
                  if ((LowestSoFar == null)||(HighestSoFar == null))
                  {
                      LowestSoFar = OscAvg;
                      HighestSoFar = OscAvg;
                      LowestSoFar_1 = OscAvg;
                      HighestSoFar_1 = OscAvg;
                      return;
                  }
                  if (OscAvg < LowestSoFar_1) LowestSoFar = OscAvg;
                  else LowestSoFar = LowestSoFar_1;
                  if (OscAvg > HighestSoFar_1) HighestSoFar = OscAvg;
                  else HighestSoFar = HighestSoFar_1;
                  if (BarState == BARSTATE_NEWBAR)
                  {
                      LowestSoFar_1 = LowestSoFar;
                      HighestSoFar_1 = HighestSoFar;
                  }
                  var MidPnt = (LowestSoFar + HighestSoFar) / 2;
                  var Res = MidPnt - (MAVal - OscAvg);
                  return new Array(Res, LowBand, HiBand);
              }

              Comment


              • EFS STudy

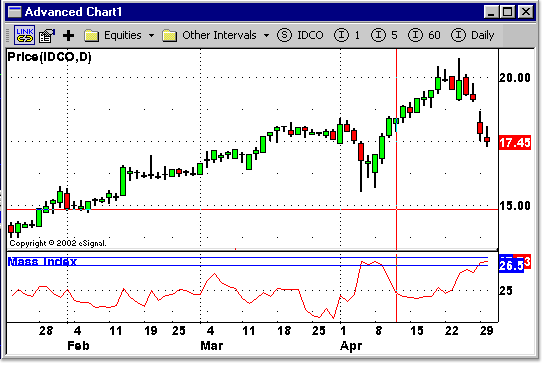
                Our next study is the MASS Index oscillator.

                Oscillators > MASS Index [eSignal EFS Indicators]

                Download: http://share.esignal.com/download.js...=MassIndex.efs

                Category: Indicator > Oscillators

                Description:

                The Mass Index was designed to identify trend reversals by measuring the narrowing and widening of the range between the high and low prices. As this range widens, the Mass Index increases; as the range narrows the Mass Index decreases.

                The Mass Index was developed by Donald Dorsey.

                Usage:

                The Mass Index is used to warn of an impending direction change. Therefore, the theory is that when a bulge occurs, you should take a position in the opposite direction.


                Inputs:

                nLENGTH1 - number of periods for the exponential moving average
                nLENGTH2 - number of periods for the summation and second exponential moving average
                nSetup - sutup line
                NTrigger - trigger line

                EFS Code:

                Code:
                /*******************************************************************
                Description	: This Indicator plots MASS Index
                Provided By	: Developed by TS Support, LLC for eSignal. (c) Copyright 2002
                ********************************************************************/
                
                function preMain()
                {
                    setStudyTitle("Mass Index");
                
                    setCursorLabelName("MassIndex", 0);
                    setCursorLabelName("Setup", 1);
                    setCursorLabelName("Trigger", 2);
                
                    setDefaultBarFgColor(Color.red, 0);
                	setDefaultBarFgColor(Color.blue, 1); 
                	setDefaultBarFgColor(Color.blue, 2); 
                
                }
                var XA1_1 = 0.0;
                var XA1_11 = 0.0;
                var XA2_1 = XA1_1;
                function main(nSetup, nTrigger, nLength1,nLength2)
                {
                    var BarState = getBarState();
                    var Setup =27;
                    if (nSetup != null) Setup = nSetup;
                    var Trigger = 26.5;
                    if (nTrigger != null) Trigger = nTrigger;
                    var len1 = 9;
                    if (nLength1 != null) len1 = nLength1;
                    var len2 = 25;
                    if (nLength2 != null) len2 = nLength2;
                    var Factor1 = 2 / (len1 + 1);
                    var Factor2 = 2 / (len2 + 1);
                    var vHigh = getValue("High",0,-(len1 + len2 + 1));
                    var vLow = getValue("Low",0,-(len1 + len2 + 1));
                    var SumXAvg = 0.0;
                    var SmoothXAvg = 0.0;
                    var i = 0;
                    var j = 0;
                    var Range = 0.0;
                    var XA1 = 0.0;
                    Range = vHigh[0] - vLow[0];
                    XA1 = Factor1 * Range + (1 - Factor1) * XA1_11;
                    if (BarState == BARSTATE_NEWBAR) XA1_11 = XA1;
                    SmoothXAvg = Factor2 * XA1 + (1 - Factor2) * XA2_1;
                    if (BarState == BARSTATE_NEWBAR) XA2_1 = SmoothXAvg;
                    for (i = 0;i < len2;i++)
                    {
                        //XAverage(Range, Length1)
                        Range = vHigh[i] - vLow[i];
                        XA1 = Factor1 * Range + (1 - Factor1) * XA1_1;
                        if (BarState == BARSTATE_NEWBAR) XA1_1 = XA1;
                        SumXAvg += XA1;        
                    }
                    var MassIndex = 0.0;
                    if (SmoothXAvg != 0) MassIndex = SumXAvg / SmoothXAvg;
                    else MassIndex = 0.0;
                    return new Array(MassIndex,Setup,Trigger);
                }

                Comment


                • Lines Not Drawn

                  I can not get the Black line to update on a 3M or 55T chart. It will if I reload the Indicator..otherwise it will not


                  Thanks

                  Comment


                  • Re: EFS Studies #3 - Fisher Transform

                    I've been using the Fisher Transform in Tradestation and decided to try the EFS version. However, the plots they produce do not appear to be identical. The turns in Tradestation seem to be a bar or two faster and have a few more wiggles in it.

                    I'm afraid I'm not an EFS programmer but I've looked at the code for the two adn they seem to be identical. I wonder if someone could take a look and suggest where the error may lie.

                    I attach screen shots of the two systems and copy below the code for both. Incidentally, I've been using the fisher(2) code ammended by Alex (I think) as the original doesn't seem to update in real time.


                    function preMain()
                    {
                    setStudyTitle("Ehlers");
                    setCursorLabelName("Fisher", 0);
                    setCursorLabelName("Trigger", 1);
                    setDefaultBarFgColor(Color.red, 0);
                    setDefaultBarFgColor(Color.black, 1);


                    }
                    var Fish = 0;
                    var Fish_1 = 0;
                    var Value1 = 0;
                    var Value1_1 = 0;
                    var temp = 0;

                    function main(Len) {
                    if (Len == null)
                    Len = 10;

                    if(getBarState() == BARSTATE_NEWBAR) {
                    temp = Fish;
                    Fish_1 = Fish;
                    Value1_1 = Value1;
                    }

                    var Price = (high() + low()) / 2;
                    var MaxH = 0;
                    var MinL = 0;
                    var i;
                    setBarThickness(2,0);
                    setBarThickness(2,1);
                    for(i = 0; i < Len; i++)
                    if(i == 0){
                    MaxH = high();
                    MinL = low()
                    }
                    else{
                    MaxH = Math.max(MaxH, high(-i));
                    MinL = Math.min(MinL, low(-i));
                    }

                    Value1 = .33 * 2 * ((Price - MinL) / (MaxH - MinL) - .5) + .67 * Value1_1;

                    if(Value1 > .99)
                    Value1 = .999;
                    if(Value1 < -.99)
                    Value1 = -.999;

                    Fish = .5 * Math.log((1 + Value1) / (1 - Value1)) + .5 * Fish_1;


                    return new Array(Fish,temp);
                    }


                    { Easy Language Fisher Transform }

                    Inputs: Price((H+L)/2),Len(9);
                    Vars: MaxH(0),MinL(0),Fish(0);

                    MaxH = Highest(Price, Len);
                    MinL = Lowest(Price, Len);
                    if (MaxH - MinL)<>0 then Value1 = .33*2*((Price - MinL)/(MaxH - MinL) - .5) + .67*Value1[1];
                    If Value1 > .99 then Value1 = .999;
                    If Value1 < -.99 then Value1 = -.999;
                    Fish = .5*Log((1 + Value1)/(1 - Value1)) + .5*Fish[1];

                    Plot1(Fish, "Fisher");
                    Plot2(Fish[1], "Trigger");
                    Plot3(0,"0");
                    Last edited by iantrader; 02-05-2004, 11:14 AM.

                    Comment


                    • Browser is locking when I try to attach a file. Let's see if this works...

                      Ian
                      Attached Files

                      Comment


                      • And here's the EFS plot....
                        Attached Files

                        Comment


                        • I don't know what the problem is but here is the Fisher script that works properly.
                          Attached Files

                          Comment


                          • Originally posted by whatever
                            I don't know what the problem is but here is the Fisher script that works properly.
                            Yes, that's the version I'm using and whose code I copied below.

                            Ian

                            Comment


                            • This problem is still apparent on many charts. I wonder if some generous programming person would be kind enough to take a look and see if they can spot the cause.

                              It's really a problem for short-term trading as the eSignal version sometimes calls the turns a bar later than the TradeStation (EasyLanguage) version.

                              Also, as you can see from the screenshots, the turns on the TS version are usually very sharp whereas on the EFS version they are more rounded.

                              I'd be most grateful for any help.

                              Ian

                              Comment


                              • That is very interesting. Can you post a copy of the TStation code in "txt" format.

                                I would like the code to written using ALLBARS instead of NEWBAR to see if that might make a difference. I am not good enough to convert it. All my attempts have failed.

                                Maybe someone could convert it for us.

                                Thanks

                                Comment

                                Working...
                                X