Announcement

Collapse
No announcement yet.

EFS Studies

Collapse
This topic is closed.
X
X
 
  • Filter
  • Time
  • Show
Clear All
new posts

  • Originally posted by whatever
    That is very interesting. Can you post a copy of the TStation code in "txt" format.

    I would like the code to written using ALLBARS instead of NEWBAR to see if that might make a difference. I am not good enough to convert it. All my attempts have failed.

    Maybe someone could convert it for us.

    Thanks
    Both sets of code are quoted below. Somewhere (:-). Here's the TS code again:

    { Easy Language Fisher Transform }

    Inputs: Price((H+L)/2),Len(9);
    Vars: MaxH(0),MinL(0),Fish(0);

    MaxH = Highest(Price, Len);
    MinL = Lowest(Price, Len);
    if (MaxH - MinL)<>0 then Value1 = .33*2*((Price - MinL)/(MaxH - MinL) - .5) + .67*Value1[1];
    If Value1 > .99 then Value1 = .999;
    If Value1 < -.99 then Value1 = -.999;
    Fish = .5*Log((1 + Value1)/(1 - Value1)) + .5*Fish[1];

    Plot1(Fish, "Fisher");
    Plot2(Fish[1], "Trigger");
    Plot3(0,"0");

    I'm afraid I'm not much of an EFS programmer. I changed the instance of NEWBAR to ALLBARS but only got one plot and nothing like the original, so that is either not the solution or maybe I'm not using it correctly.

    Ian
    Comment


    • I can only think of two possible reasons why there would be a difference;
      1) Different input values
      2) Different ways of processing the equations. One uses double precision and the other does not.

      AYes I have already tried changing NEWBAR to ALLBARS and it does not work. You have to create an array with ALLBARS. I going to give it a try again today.

      Comment


      • Originally posted by whatever
        I can only think of two possible reasons why there would be a difference;
        1) Different input values
        2) Different ways of processing the equations. One uses double precision and the other does not.

        AYes I have already tried changing NEWBAR to ALLBARS and it does not work. You have to create an array with ALLBARS. I going to give it a try again today.
        I don't know how to program EFS so no wonder my ALLBARS was wrong... I look forward to your results.

        What's this double precision thing? Is that a function of the language/system or do we have some control over it?

        Ian

        Comment


        • Ehlers study - Fisher Transform

          Iantrader,

          There was a difference with the Price variable and the default sampling length. This version should look just like your Tradestation's.

          Rich

          //modified to look like Tradestation version
          addBand(1.5, PS_SOLID, 2, Color.red, "1.5");
          addBand(1.38, PS_DASH, 1, Color.white, "1.38");
          addBand(1.25, PS_DASH, 1, Color.white, "1.25");
          addBand(1, PS_DASH, 1, Color.black, "1");
          addBand(.75, PS_DASH, 1, Color.yellow, ".75");
          addBand(.5, PS_DASH, 1, Color.white, ".5");
          addBand(0, PS_SOLID, 2, Color.green, "0");
          addBand(-.5, PS_DASH, 1, Color.white, "-.5");
          addBand(-.75, PS_DASH, 1, Color.yellow, "-.75");
          addBand(-1, PS_DASH, 1, Color.black, "-1");
          addBand(-1.25, PS_DASH, 1, Color.white, "-1.25");
          addBand(-1.38, PS_DASH, 1, Color.white, "-1.38");
          addBand(-1.5, PS_SOLID, 2, Color.red, "-1.5");


          function preMain()
          {
          setStudyTitle("Ehlers");
          setCursorLabelName("Fisher", 0);
          setCursorLabelName("Trigger", 1);
          setDefaultBarFgColor(Color.red, 0);
          setDefaultBarFgColor(Color.black, 1);


          }
          var Fish = 0;
          var Fish_1 = 0;
          var Value1 = 0;
          var Value1_1 = 0;


          function main(Len) {
          if (Len == null)
          Len = 9;//changed default from 10

          if(getBarState() == BARSTATE_NEWBAR) {

          Fish_1 = Fish;
          Value1_1 = Value1;
          }

          var Price = (high() + low()) / 2;
          var Pricei= (high() + low()) / 2;//added this variable
          var MaxH = 0;
          var MinL = 0;
          var i;
          setBarThickness(2,0);
          setBarThickness(2,1);
          for(i = 0; i < Len; i++) {
          Pricei = (high(-i) + low(-i)) / 2; //added this line
          if(i == 0){
          MaxH = Pricei;//changed from: MaxH = high()
          MinL = Pricei;//changed from: MaxH = low()
          }
          else{
          MaxH = Math.max(MaxH, Pricei);//changed from: MaxH = Math.max(MaxH, high(-i))
          MinL = Math.min(MinL, Pricei);//changed from: MinL = Math.min(MinL, low(-i))
          }
          }
          Value1 = .33 * 2 * ((Price - MinL) / (MaxH - MinL) - .5) + .67 * Value1_1;

          if(Value1 > .99)
          Value1 = .999;
          if(Value1 < -.99)
          Value1 = -.999;

          Fish = .5 * Math.log((1 + Value1) / (1 - Value1)) + .5 * Fish_1;


          return new Array(Fish,Fish_1);//removed the redundant temp variable, use Fish_1 instead
          }

          Comment


          • Re: Ehlers study - Fisher Transform

            Thanks Rich, looks like your Fisher Transform is a bit more sensitive and has a bigger range than the one provided by TS. However, based on the charts I saw here, the Fisher Transform of Tradestation is usually two bars earlier than the TS's one. However, your Fisher Transform is just slightly more sensitive, maybe "half a bar" early. Any idea why is this happening?

            I see that you've added a lot of bands in the indicator, how exactly do you use these bands, and why pick those numbers to draw the bands?

            Thanks for posting the code!

            Bernard

            Comment


            • TS vs eSignal

              I don't know why the TS version differs from the eSignal one.I "eyeballed" the charts that were provided in this thread and the new code seemed to track more like the TS version. I don't have TS so I can't really investigate. I take no credit for the original code (and band placement). I simple modified the efs that was provided in this thread. I saw a programming logic difference between the TS and eSignal versions and decided to try and help out. I imagine that you can "tune down" the sensitivity by increasing the Len variable (but of course that doesn't explain the difference).

              Comment


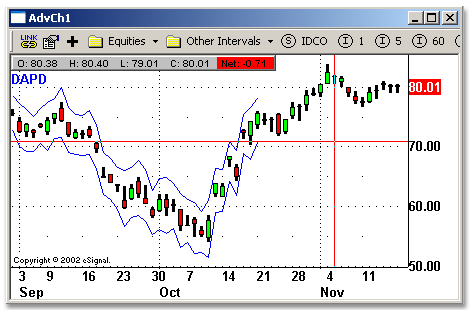
              • New Study ##

                Our next study is the DAPD - Daily Average Price Delta.

                Oscillators > DAPD - Daily Average Price Delta [eSignal EFS Indicators]

                Download: http://share.esignal.com/download.js...&file=DAPD.efs

                Category: Indicator > Bands

                Description:

                This indicator is similar to Bollinger Bands. It based on DAPD - Daily Average Price Delta. DAPD is based upon a summation for each of the highs (hod) for the 21 days prior to today minus the summation for each of the lows (lod) for the last 21 days prior to today. The result of this calculation would then be divided by 21. The following formula represents this:

                DAPD = (Sum(21 HODS) - Sum(21 LODS))/21

                The formulas for lines would be as follows:

                Upper line = today's low + DAPD; Lower line = today's high - DAPD


                Inputs:

                Length - number of bars to use in the calculation

                EFS Code:

                Code:
                /*******************************************************************
                Provided By	: TS Support, LLC for eSignal. (c) Copyright 2002  
                ********************************************************************/
                
                function preMain()
                {
                    setStudyTitle("DAPD");
                    setCursorLabelName("Top DAPD", 0);
                    setCursorLabelName("Bottom DAPD", 1);
                    setDefaultBarFgColor(Color.blue, 0);
                    setDefaultBarFgColor(Color.blue, 1);
                    setPriceStudy(true);
                }
                
                var ghigh = 0;
                
                function main(Length) {
                	if (Length == null) 
                		Length = 21;
                	var i = 0;
                	var dh = 0;
                	var DAPD = 0;
                	var hSum =0, lSum = 0;
                	
                	vHigh = getValue("high",0,Length);
                	vLow = getValue("low",0,Length);
                	if(vHigh == null || vLow == null)
                		return;
                	for(i = 0; i < Length; i++){
                		hSum += vHigh[i];
                		lSum += vLow[i];
                	}
                	DAPD = (hSum - lSum) / Length;
                	return new Array(high() + DAPD, low() - DAPD);
                	
                	
                }

                Comment


                • Mode Indicator

                  Hi TS, would you consider to convert John Ehlers' Mode Indicator? I know the TradeStation code is available out there... TIA!

                  Comment


                  • Two ma's with Z-Force?

                    Hello TS,
                    On 1/09/03 in this forum you wrote about the Z-Force Indicator by Veronique Valcu posted in 'Stocks and Commodities';

                    http://www.traders.com/Documentation...l#tradestation

                    The .efs file is listed in this forum but lacks some information posted with the Tradestation version of the indicator(see above link). The TS version provides info for setting up two ma's with the crossings providing the signals. Could you translate this into "eSignalese" for me? They define the two ma's as;

                    "The inputs for the Custom 1 Line indicator were "zscore(Close,20)" and "False." The inputs for the Custom 2 Line indicator were "Average(ZScore(Close,20),3)", "Average(Average(ZScore(Close,20),3),5)", and "False.""

                    I tried overlaying two of the Z-Force ma indicators in eSignal but despite all proper adjustments('Display Top', Display Right") the white '0' lines don't match up and the crossovers move around as the chart is moved forward or backward in time. Is it possible to write the .efs file for two Z-Force ma's with the adjustable settings noted in the Tradestation text? I have attached the small chart image provided at S&C to display the resulting double Z-Force ma's.
                    Thanks very much for your help.
                    Attached Files

                    Comment


                    • Hi jouster,

                      Please see the strategy attached and let us know how it works.

                      Regards,
                      Robert
                      Attached Files

                      Comment


                      • Excellent Z-Force!

                        Hello Robert,
                        Many thanks for the Z-Force indicator. It works very nicely with the Bollinger 20,2 as the Veronique Valcu S&C article recommends. Other indicators can assist holding onto a trend but the first touch of the opposite BB band is the safe exit. There's only one curious detail which might not take much to adjust. With my settings the short/long signals occur opposite to the price movement? That is, the text + arrows print when the Smooth2 (green) line crosses over both the Z-Score (red) and Smooth1 (blue) line? Under=short, over=long.

                        With my settings; Z-Force period(red) at 20, Smooth1 (blue) at 5, and Smooth2 (green) at 14, the Z-Score line crossing both Smooth 1&2 should key the signal. Crossing above=long, below=short. I've drawn in these moves with the larger red/green arrows on the chart.

                        The previous settings are not the default settings but seemed to work better for me. Am I using the indicator correctly? If so could you adjust the short-long signals? If I'm not using it 'correctly' I like these results and look forward to testing it further. Great work!
                        Attached Files

                        Comment


                        • Hi Jouster,

                          Could you please explain what you mean by 'the Z-Score line crossing both Smooth 1&2'.

                          Thanks,
                          Robert

                          Comment


                          • Z-Score Crossing..

                            Hello Robert,
                            When I suggested that the short/long signals be indicated by 'the Z-Score line crossing both Smooth 1&2' I was referring to the red line crossing over or under the blue and green lines. See chart close-up below. For the purposes of writing the formula I suppose its probably best to only use the time that the Z-Score (red) crosses above(=long) or below(=short) the Smooth 2 (green) line as the trigger. The slightly smoothed version of the Z-score, the 'Smooth2'-blue, lags the red but is helpful to provide a confirming indication of the trend switch initiated by the red Z-score crossing the green Smooth 2. But the faster red Z-score initiates the trade. My reason for previously suggesting that both blue then green should be crossed over, was to avoid false signals which would sometimes occur as in the close-up I've posted following this. But that probably complicates the formula quite a bit??

                            At the risk of asking for too much there are several additional details that might be nice to have in the strategy. That said, please ignore these if they're too complicated or time-consuming to include.
                            1.) At the link I previously posted it was mentioned that the best trades occurred when the Z-Score line had recently rebounded from >+2.0 or < -2.0. Is it possible to add this as a condition for a short/long signal? Or perhaps to make a distinction between these and other signals with a bigger arrow or arrow+ text..?
                            2.) A second detail would be an optional sound alert when the trade signals are triggered.
                            3.) Third; could the Z-Score line adjust real-time with the price bar movements rather than at the close of the price bar?

                            In the Tradestation version of the Valcu Z-score formula listed below, only two smoothed versions of the Z-score line are used. I think your version with three is better. My suggestions as to when short/longs are triggered is from playing with your version of the indicator. I did not read the complete original article in Stocks and Commodities so am no expert on what Veronique Valcu's precise intention was for trading the Z-Score. What you have translated, however, seems to have great trading potential--Much Thanks!


                            Strategy: ZScore Test
                            inputs:
                            Price( Close ),
                            AvgLen( 20 ),
                            Smooth1( 3 ),
                            Smooth2( 5 ) ;
                            variables:
                            Curve1( 0 ),
                            Curve2( 0 ) ;
                            Curve1 = Average( ZScore( Price, AvgLen), Smooth1 ) ;
                            Curve2 = Average( Curve1, Smooth2 ) ;
                            if Curve1 Crosses Over Curve2 then
                            Buy Next Bar at Market ;
                            if Curve1 Crosses Under Curve2 then
                            SellShort Next Bar at Market ;
                            Attached Files

                            Comment


                            • Z-Score zig-zag

                              Robert,
                              Here's the occassional false signal that can be generated when the red Z-Score line crosses the green 'Smooth 2'. Requiring that the sequence; first blue smooth 1, then green smooth 2, be crossed by red Z-Score for a trade signal might filter these false signals out. Probably also more complicated to formulate!!
                              Attached Files

                              Comment


                              • Re: EFS Study:

                                Hi. Seems like this thread has been left untouched for quite a while. I'm wondering if anyone is able to advise me on how I could add a direction line to the TDI that was posted by TS Support?

                                I'll really appreciates the help.

                                3/3

                                Originally posted by TS Support
                                hi Wavetrader, here TDI indicator i have asked for:

                                Trend Identificator > Trend Direction Index (TDI) [eSignal EFS Indicators]

                                Download:

                                http://share.esignal.com/download.js...r&file=tdi.efs

                                Category: Trend Identificator

                                Description:

                                The Trend Detection Index (TDI) was introduced by M. H. Pee. TDI is used to detect when a trend has begun and when it has come to an end. The TDI can be used as a stand-alone indicator or combined with others; it will perform well in detecting the beginning of trends. TDI should be used in conjunction with protective stops as well as trailing stops. These stops are required to protect against large losses when the indicator generates a losing trade. The TDI can trade a diverse portfolio of markets profitably over many years, using the same parameters throughout.

                                To calculate the 20-day trend detection index, first find the value of the momentum indicator. After the market closes, calculate today's 20-day momentum by subtracting the close 20 days ago from that of today. Next, find the 20-day absolute momentum, which is defined as the absolute value of today's 20-day momentum. More details can be found in the formula section above.

                                The trend detection index will signal a trend if it shows a positive value and a consolidation if it shows a negative value. As a trend-follower, the position should be entered in the direction of the trend when the TDI is positive. To determine the current direction of the trend, the direction indicator can be used, which is defined as the sum of the 20-day momentum of the last 20 days. An uptrend is signaled by a positive direction indicator value, whereas a downtrend is signaled by a negative value. Basically, it comes down to this: Enter long tomorrow at the open if both the TDI and direction indicator are positive after today's close or enter short at the open if the TDI is positive and the direction indicator is negative.


                                Inputs:

                                Period - number of bars to calculate

                                EFS Code:

                                Code:
                                /*******************************************************************
                                Description	: This Indicator plots the Trend Detection Indexs
                                Provided By	: TS Support, LLC for eSignal
                                ********************************************************************/
                                
                                function preMain(){
                                	setStudyTitle("Trend Detection Index");
                                	setCursorLabelName("TDI",0);
                                	setDefaultBarFgColor(Color.blue,0);
                                	    addBand(0, PS_SOLID, 1, Color.lightgrey);
                                
                                }
                                
                                mom = null;
                                
                                function main(Period){
                                	if(Period == null)
                                		Period = 12;
                                	if(mom == null)
                                		mom = new MOMStudy(Period, "Close");
                                
                                	var MomSum = 0, MomSumAbs = 0; MomAbsSum = 0, MomAbsSum2 = 0;
                                	
                                	for(i = -Period + 1; i++; i <= 0)
                                		MomSum += mom.getValue(MOMStudy.MOM,i);
                                	
                                	MomSumAbs = Math.abs(MomSum);
                                	
                                	for(i = -Period + 1; i++; i <= 0)
                                		MomAbsSum += Math.abs(mom.getValue(MOMStudy.MOM,i));
                                		
                                	for(i = -Period * 2 + 1; i++; i <= 0)
                                		MomAbsSum2 += Math.abs(mom.getValue(MOMStudy.MOM,i));
                                	TDI = MomSumAbs - (MomAbsSum2 - MomAbsSum);
                                	
                                	
                                	return TDI;
                                }

                                Comment

                                Working...
                                X