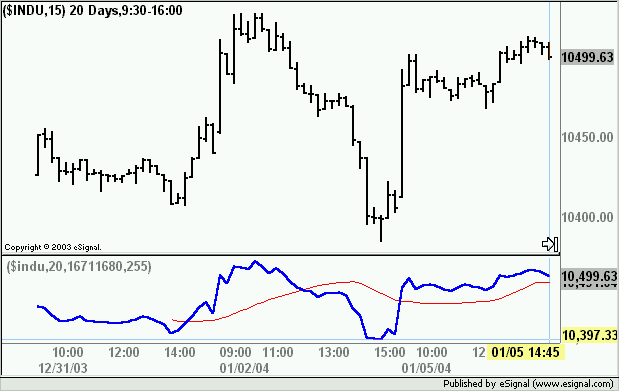
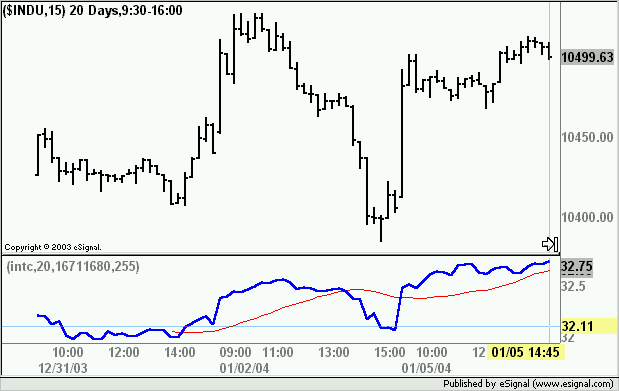
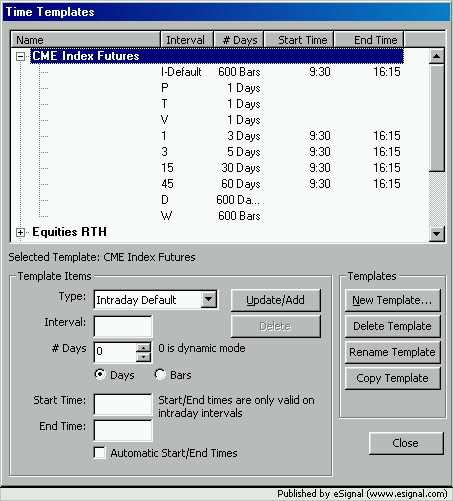
I have an efs that plots a symbol along with its ma as an efs. Alex was so kind as to help me with it some time ago. I have a question on it though. Seems like the charts will only load a limited amount of data for this efs. It seems to vary by the time period, and I have not been able to determine that a certain number of bars is the determining factor. So for you wizards out there, what is limiting the amount of data loaded/displayed by the efs, and what would I do to change it?
Here is the efs.
I will post a picture of the problem in the next post.
Here is the efs.
I will post a picture of the problem in the next post.


Comment