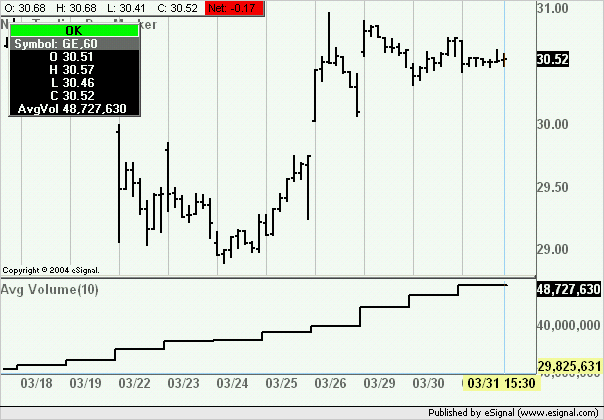
Qcharts has some great features I would like to see in Esignal. Most importantly for a momentum trader, IMO, is the ability to see quickly a lot of information ON the chart itself.
Does anyone know of any EFS code that puts the AVG daily volume on the chart itself as a study, and maybe compare it to the current day's intraday volume total, or something like this? For example, I pull up the chart and I want to see the volume the stock has done thus far in total and then see the average daily volume for that stock -- mind you, on an INTRADAY chart. I know you can have a daily chart up to give you this information, but it would be helpful to get this info on an intraday chart at a glance - especially when screen real estate is so tight. For that matter, it SHOULD be an otion on the snapshot view, but it is NOT.
Any help or advice regarding this would be very much appreciated. Thanks in advance for reading and for your time.
-- Gene


Comment