Announcement

Collapse
No announcement yet.

Larry Connor's Historical Volatility

Collapse
X
 
  • Filter
  • Time
  • Show
Clear All
new posts

  • Larry Connor's Historical Volatility

    Can someone please help me convert Larry Connor's Historical 6/100 volatility.. from my metastock language...

    ((Std(Log(C/Ref(C,-1)),6)*Sqrt(256)*100) /
    (Std(Log(C/Ref(C,-1)),100)*Sqrt(256)*100)) <=.5
    ----------------------------------------------------------------

    In English:

    Divide today’s close by yesterday’s close.
    Take the natural log of #1.
    Take the standard deviation of #2 for length desired (the number of trading days, i.e. 50)
    Multiply #3 by 100.
    Multiply #4 by the square root of the number of trading days in 1 year (256).
    --------------------------
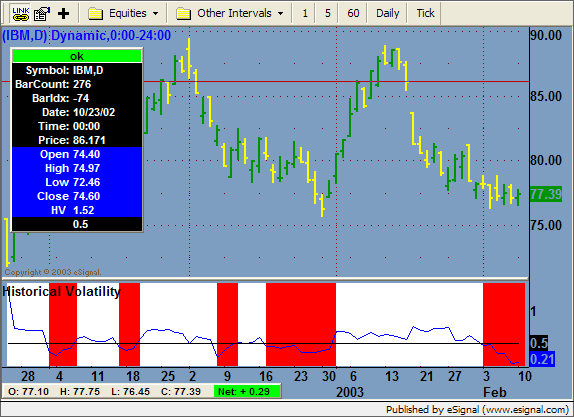
    What you are doing is dividing the 6 by the 100 day historical volatility. When the value is less than .50 than you have abnormal low volatility..

    --- My request.. can someone make this into an indicator by taking the 6/100 historical volaility and place .50 as a solid line?? Also can you paint the bars any time the same value is under .50??


    ---MIKE

  • #2
    Hello Mike,

    I've created this formula for you. Click here to download ConnorHistVolatility.efs.

    Compare this to your metastock version to make sure we are matching. The background of the indicator will be white above .5 and red when below.

    Jason K.
    Project Manager
    eSignal - an Interactive Data company

    EFS KnowledgeBase
    JavaScript for EFS Video Series
    EFS Beginner Tutorial Series
    EFS Glossary
    Custom EFS Development Policy

    New User Orientation

    Comment


    • #3
      Thanks.. but it doesnt let me download.

      Comment


      • #4
        My downloads from Esignal have been slow lately too

        This one was slow also, about 1-2 minutes before it came through.

        /************************************************** **************************************************
        Copyright © eSignal, a division of Interactive Data Corporation. 2003. All rights reserved.
        This sample eSignal Formula Script (EFS) may be modified and saved under a new
        filename; however, eSignal is no longer responsible for the functionality once modified.
        eSignal reserves the right to modify and overwrite this EFS file with each new release.
        ************************************************** ************************************************** */


        function preMain() {
        setStudyTitle("Historical Volatility");
        setCursorLabelName("HV ", 0);
        setCursorLabelName(" ", 1);
        setDefaultBarFgColor(Color.blue, 0);
        setDefaultBarFgColor(Color.black, 1);
        }

        function STDV(length) {
        var sumX = 0;
        var sumX2 = 0;
        for (i = 0; i < length; ++i) {
        sumX += aLog[i];
        sumX2 += (aLog[i] * aLog[i])
        }
        var meanX = (sumX/length);
        var stdev = Math.sqrt((sumX2/length) - (meanX*meanX));

        return stdev;
        }

        var aLog = null;

        function main(nLength1, nLength2) {
        if (nLength1 == null || nLength1 < 3)
        nLength1 = 6;
        if (nLength2 == null)
        nLength2 = 100;

        var c = close();
        if (c == null)
        return;

        if (aLog == null && close(-nLength2-1) != null) {
        aLog = new Array(nLength2);
        for (i = 0; i < nLength2; ++i) {
        aLog[i] = Math.log(close(-i)/close(-i-1));
        }
        }

        if (aLog[nLength2-1] == null)
        return;

        if (getBarState() == BARSTATE_NEWBAR) {
        aLog.pop()
        aLog.unshift(Math.log(c/close(-1)));
        } else {
        aLog[0] = Math.log(c/close(-1));
        }

        var stdv1 = STDV(nLength1);
        var stdv2 = STDV(nLength2);

        var HV = (stdv1 * Math.sqrt(256) * 100) / (stdv2 * Math.sqrt(256) * 100);

        if (HV < .5) {
        //setPriceBarColor(Color.cyan);
        setBarBgColor(Color.red);
        } else {
        setBarBgColor(Color.white);
        }

        return new Array(HV, .5);
        }

        Comment


        • #5
          OK it looks great.

          Can you change it so that the .50 is not labeled on the chart nor labeled on the cursor window properties? It clutters my chart.


          --MIKE

          Comment


          • #6
            Re: Reply to post 'Larry Connor's Historical Volatility'

            Right click on the Cursor Window and uncheck the indicator from the list. Do the same in the Price pane of the chart.
            Alex

            Last edited by ACM; 02-10-2003, 12:26 PM.

            Comment


            • #7
              I just want the .50 labels to dissapear.. and the HV to be labeled?

              If i do that.. both dissapear.


              --MIKE

              Comment

              Working...
              X