Hi there!
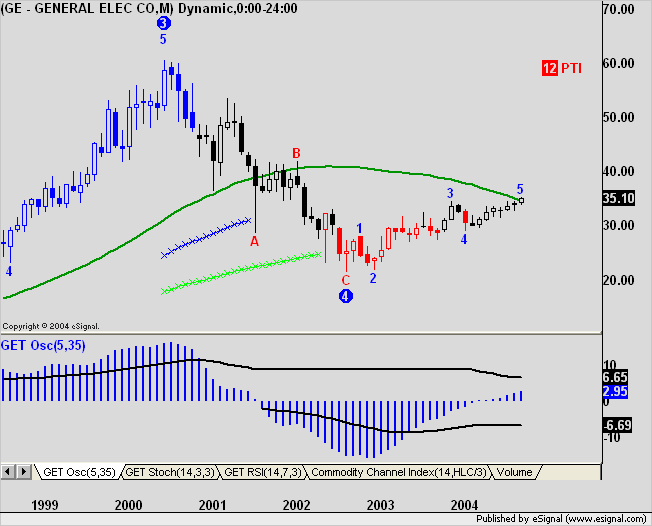
On Monday I noticed that for the monthly charts, all stocks had 2 candles for October 04, one dated 29 Oct 04 and second one dated 31 Oct 04, very confusing when one is doing analysis.
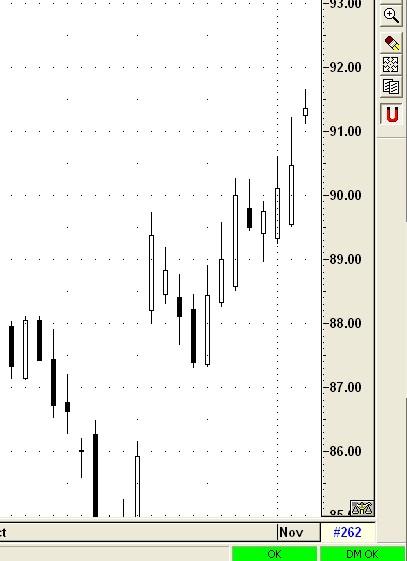
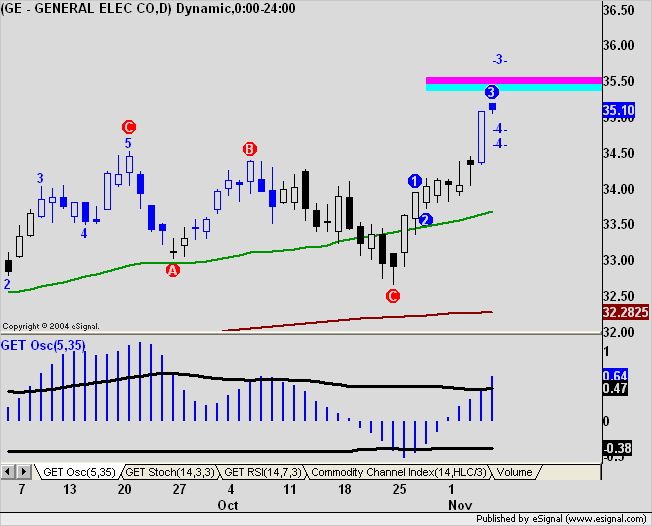
Now today I'm noticing that for some stocks it appears there's an absolutely identical candle for Tuesday & Wednesday on the daily chart? I've checked out other chart sources and they don't show the same thing! So far the daily charts with identical looking candles are coming up for:
IBM
PFE
The candles are labelled Nov 03 !!!
This is of course causing havoc on my analysis. I hope someone will get back to me with an answer asap.
I'm majorly concerned as these are mistakes I'm picking up - what am I missing which is affecting my trading?
Chris Bowers


Comment