I have watched the webinar on MOB, but I am still a bit confused about its application.
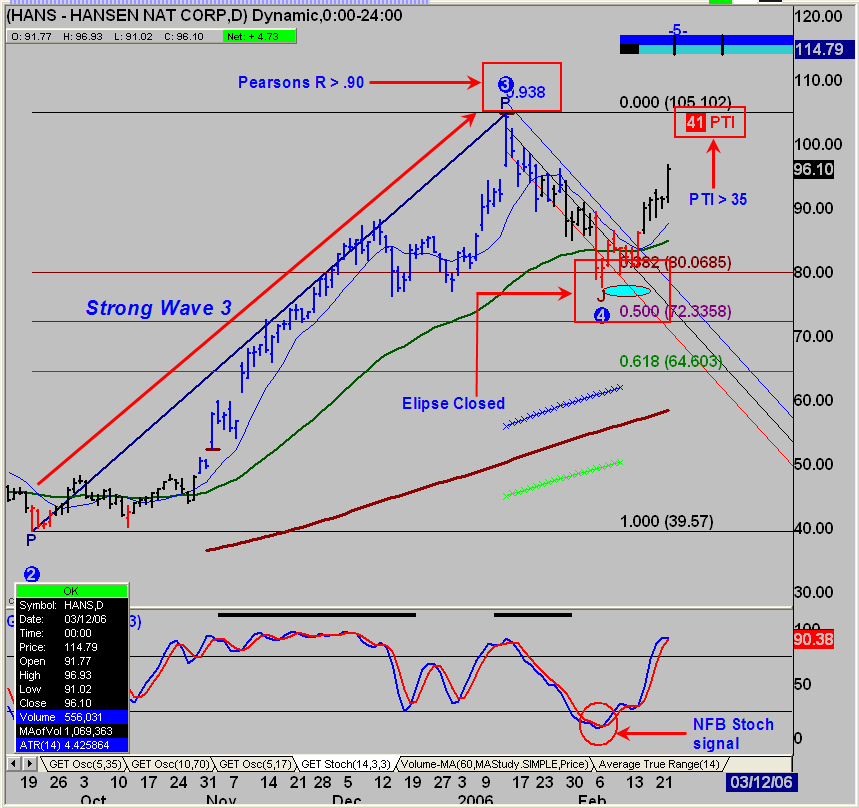
Do you click over the 1st Wave (#1) to see how high the 3rd will go?
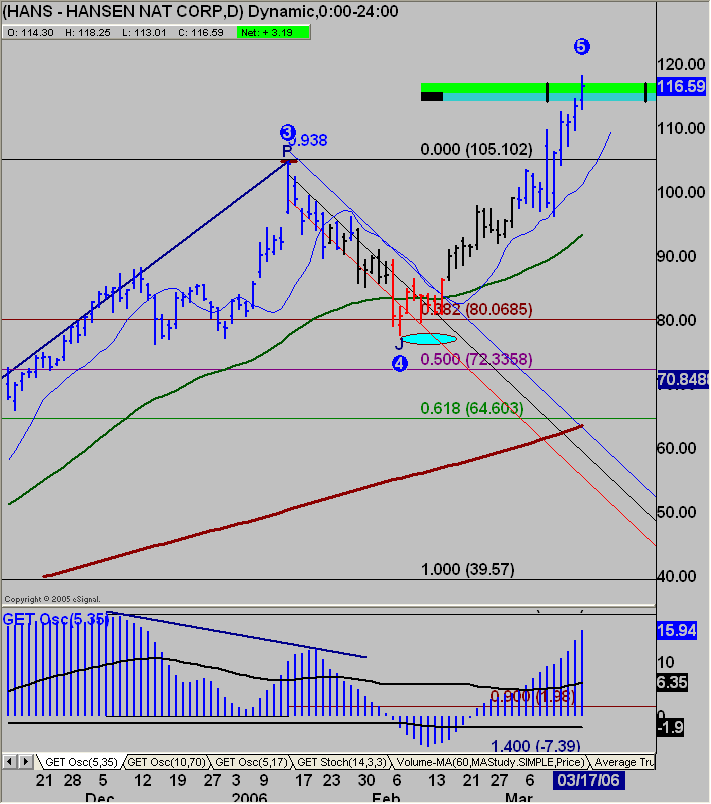
Do you click over the #3 Wave to see how high the 5th will go?
Or do you click over the last high or last low?
What is confusing about the webinar is that the 3rd Wave is a high. But what do you do if the 3rd wave is not a high (i.e. there is another high between 3 and 5)?
Also, how are the Elliot Waves related to this? Do I have to wait until the 4 is formed before I am able to click on the 3rd Wave and see how high the fifth will go?
When do I see the number form on my chart that tells me an Elliot Wave has started or completed?
Finally, what do the blue, green and red tracks represent?
Thank you.


Comment