 Tweet
Tweet
Keith
I keep hitting the RTH east coast and nada happens. Shouldn't it be minus the pre-market stuff? Not working for me. What am I doing wrong?
Right click on the chart, select Time Templates->Edit...
This will open a dialog box similar to the one in the following image.
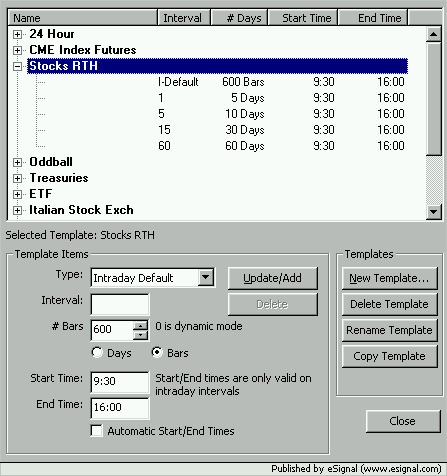
What the above means is that whenever I apply the Stocks RTH Time Template to a chart the following will happen:
If the chart interval is any other but the ones defined in the template (ie. 1, 5, 15 and 60 minutes) then the chart will load 600 bars of data and will set the Start/End times from 9:30 to 16:00. This is the Intraday Default.
If the chart interval is 1 minute then it will load 5 days worth of data with Start/End times 9:30-16:00
If the interval is 5 minutes then the days loaded will be 10, if 15 minutes then the days loaded will be 30 and lastly if 60 minutes the days loaded will be 60 all showing only the data from 9:30 to 16:00.
Knowing how this works you now need to check if the Time Template you have for RTH East Coast is set up in a similar way (it does not have to be identical). If the RTH East Coast template is not already open click the + sign next to it. Then verify that the Start/End times for all the User Defined intervals (if any) and for the Intraday Default are either set to 9:30-16:00 or Automatic. Once you have set up the Time Template to your liking click Close and apply it to the chart. You now should see the data plotted only for the RTH.
Hope this helps
Alex
I keep hitting the RTH east coast and nada happens. Shouldn't it be minus the pre-market stuff? Not working for me. What am I doing wrong?
Right click on the chart, select Time Templates->Edit...
This will open a dialog box similar to the one in the following image.
What the above means is that whenever I apply the Stocks RTH Time Template to a chart the following will happen:
If the chart interval is any other but the ones defined in the template (ie. 1, 5, 15 and 60 minutes) then the chart will load 600 bars of data and will set the Start/End times from 9:30 to 16:00. This is the Intraday Default.
If the chart interval is 1 minute then it will load 5 days worth of data with Start/End times 9:30-16:00
If the interval is 5 minutes then the days loaded will be 10, if 15 minutes then the days loaded will be 30 and lastly if 60 minutes the days loaded will be 60 all showing only the data from 9:30 to 16:00.
Knowing how this works you now need to check if the Time Template you have for RTH East Coast is set up in a similar way (it does not have to be identical). If the RTH East Coast template is not already open click the + sign next to it. Then verify that the Start/End times for all the User Defined intervals (if any) and for the Intraday Default are either set to 9:30-16:00 or Automatic. Once you have set up the Time Template to your liking click Close and apply it to the chart. You now should see the data plotted only for the RTH.
Hope this helps
Alex
Comment